 Forget 1929: maybe it’s time to start comparing the current market to 1999 again.
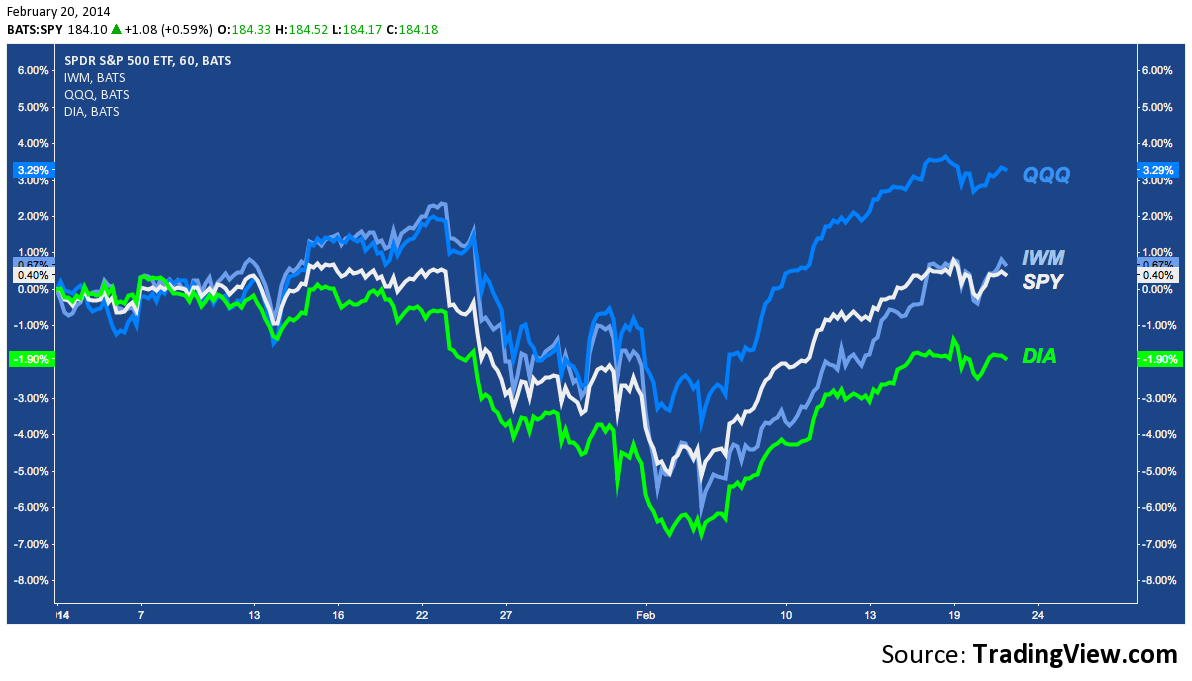
Since hammering out a bottom 2.5 weeks ago, the NASDAQ 100 (Index: NDX; ETF: QQQ) has steadily outperformed its peers among benchmark US stock indices. Up +3.29% year-to-date, QQQ is also the only index that has regained and exceeded it’s late January high – it’s even outperforming last year’s winner Russell 2000 (IWM) by 262bps, which comes in a distant second at +0.67% YTD.
NASDAQ 100 – Where Relative Strength Is At in Q1 2014 (click image to zoom)
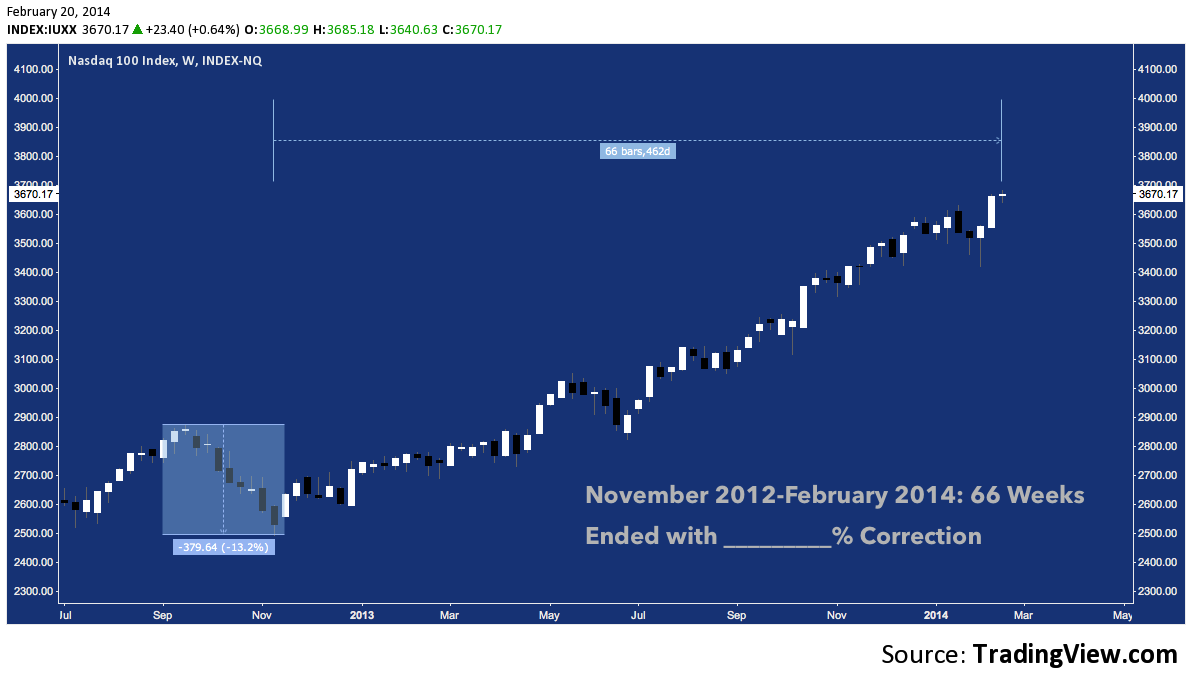
This assumption of the mantle of relative strength leadership comes at an interesting time. For all the noise QQQ has made over the last few weeks as it races ahead of the crowd to daily build new 14-year highs, the most noteworthy development has gone almost entirely unreported. In its 29 year history, at 66 weeks and counting the NASDAQ 100 has never gone so long without a -10%+ correction, far exceeding 2009-2010’s 61 week run. Moreover: closing only -0.3% off its highest levels since September 2000, the streak looks set to continue for a few more weeks, at minimum.
Since its inception in January 1985, NASDAQ 100 has installed five streaks like the current that lasted 55 weeks or more. (technical note: a streak here is defined as “the period beginning with and including the week of the previous correction’s trough, extending to and including the week a loss from the intervening highest high exceeds -10%”).
Here they are in order:
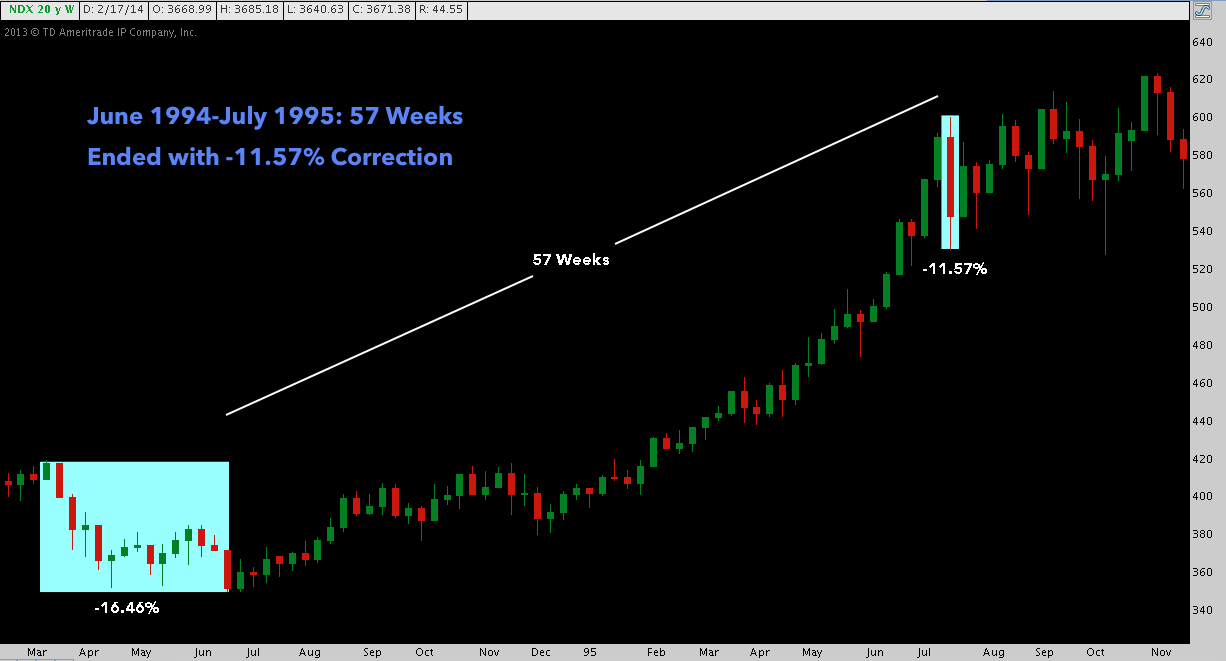
NASDAQ 100: 1994-1995 Streak – 57 Weeks (click image to zoom)
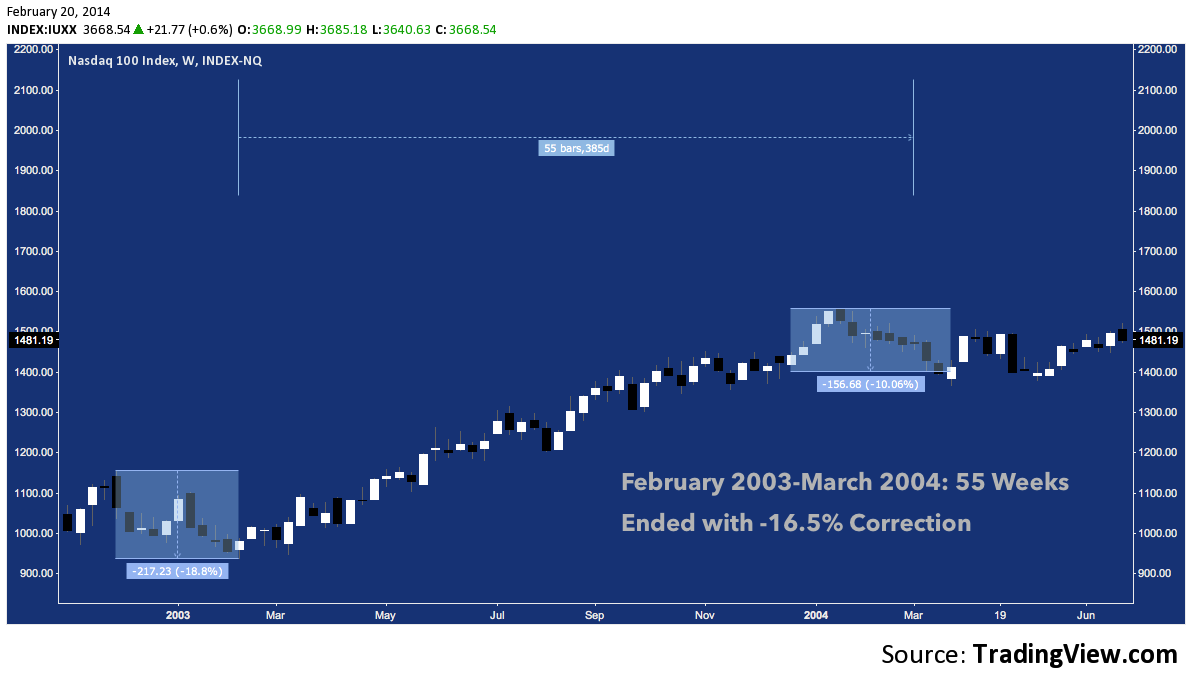
NASDAQ 100: 2003-2004 Streak – 55 weeks (click image to zoom)
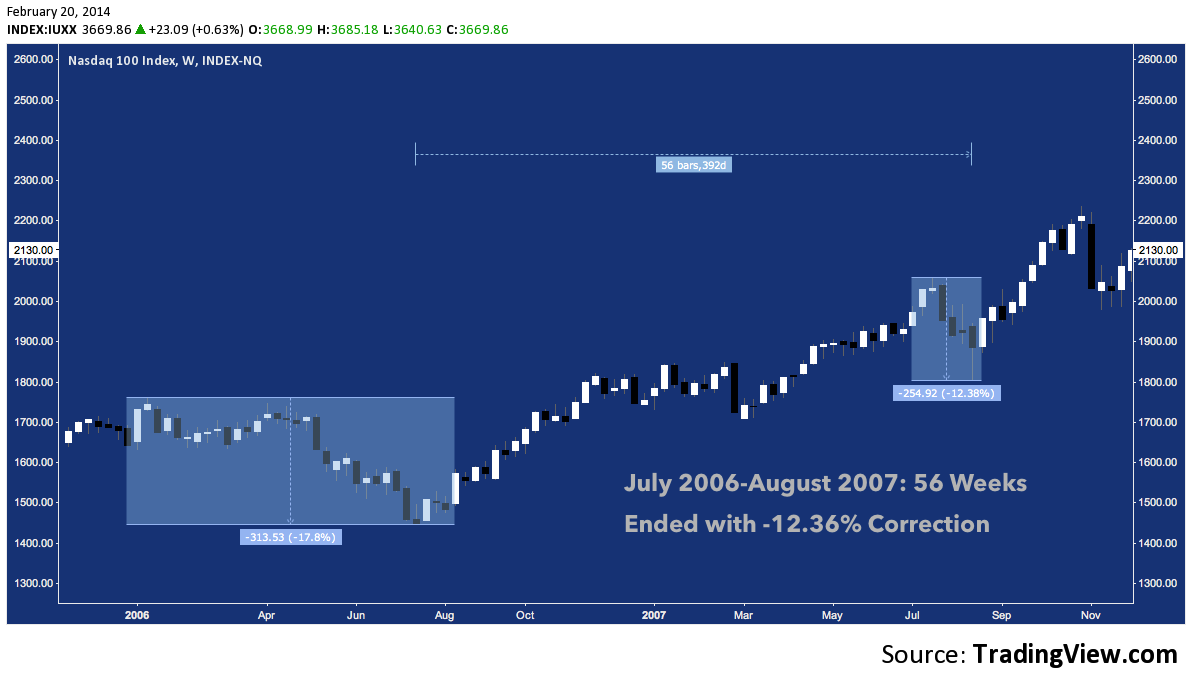
NASDAQ 100: 2006-2007 Streak – 56 weeks (click image to zoom)
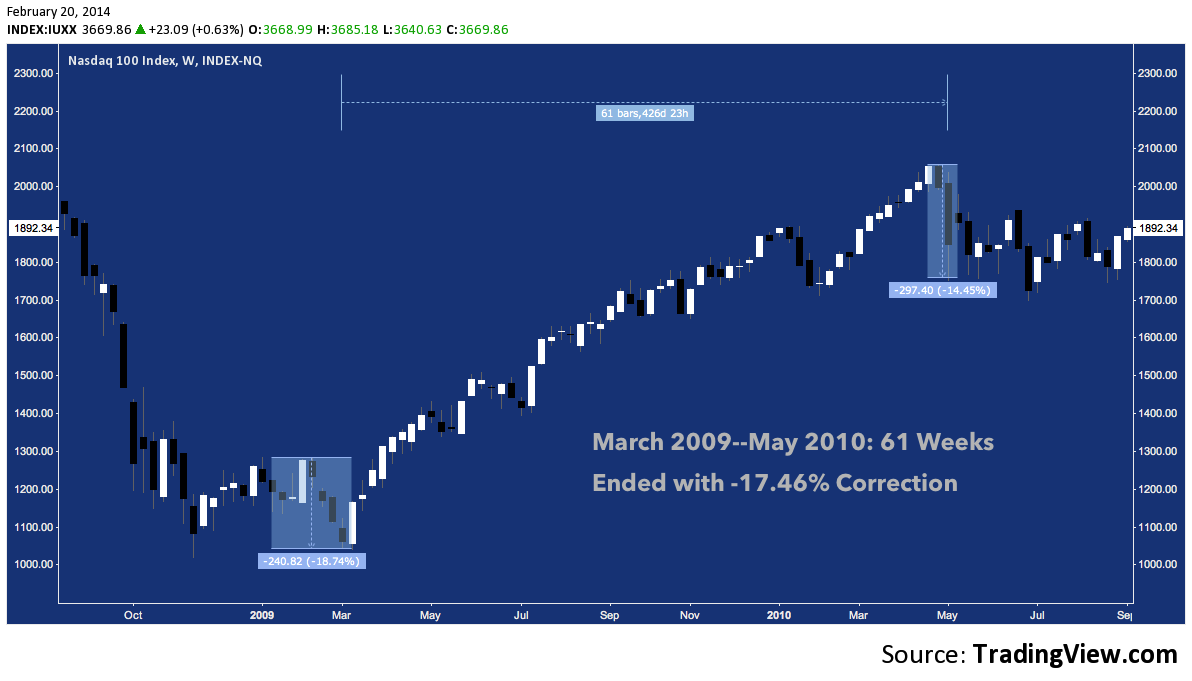
NASDAQ 100: 2009-2010 Streak – 61 weeks (click image to zoom)
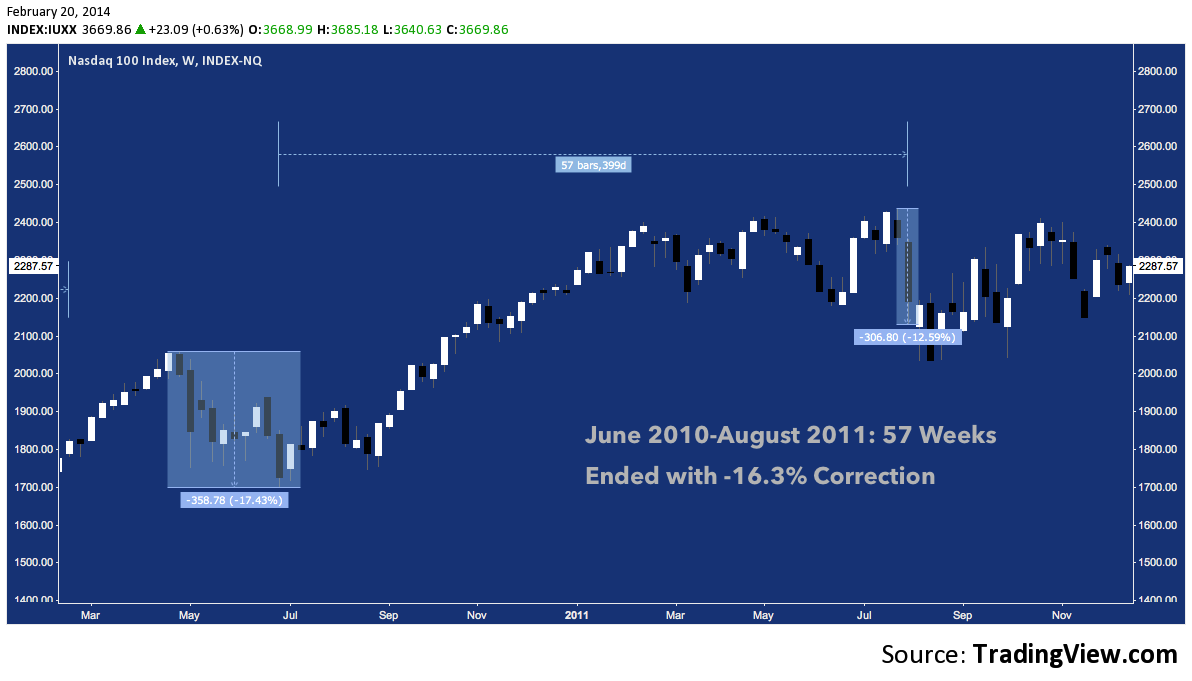
NASDAQ 100: 2010-2011 Streak – 57 weeks (click image to zoom)
And lastly, the current streak:
NASDAQ 100: 2012-2014 Streak – 66 Weeks and Climbing (click image to zoom)
The corrections ending these 5 streaks have averaged -14.84%, peak to trough. The trough-to-peak performance during these pre-correction runs predictably yields some impressive figures:
- 1994-1995: +70.45%
- 2003-2004: +66.26%
- 2006-2007: +42.59%
- 2009-2010: +97.94%
- 2010-2011: +43.1%
To date, 2013-2014 comes 3rd of 6 but clustered toward the lower half of the pack at +47.31%. This is a mitigating factor to its record duration; however, as the latest in a concentrated succession of streaks (3 of the 6 or 1/2 have occurred in the last 17% of NASDAQ 100’s life), it is coming into maturity just as a couple of major patterns built by its forebears are culminating.
For QQQ, the cyclical bull of the last 5 years boils down to a rising wedge that outlines the same massive ABCD pattern present on the likes of IWM and SPY. Now about 80% of the way to its point D, the Cubes is creeping into a dense field of fibonacci cluster resistance from 90-95. That’s a broad range (5.5%), but looking back, it echoes to the congestion found in the opening months of 2000.
NASDAQ 100 could chew this range up and move on toward 100. But with 66 weeks since the last correction (we could even make it “66 weeks since -7.5%” – this run also qualifies as the least volatile passage in NDX history), at wedge trend line resistance, at the end of a cyclical wedge and a list of overlapping key fibonacci levels that have been building for years, QQQ 85 before 95 seems highly probable.
NASDAQ 100: Rising Wedge Apex at 14 Year Cluster Resistance (click image to zoom)

What I mentioned at the very beginning in jest about comparisons to 1999 would then become true: if this wedge breaks up – a formation that the already aggressively bullish NASDAQ 100 has felt content to advance through for 1250 trading days – something like a blow off would likely be underway.
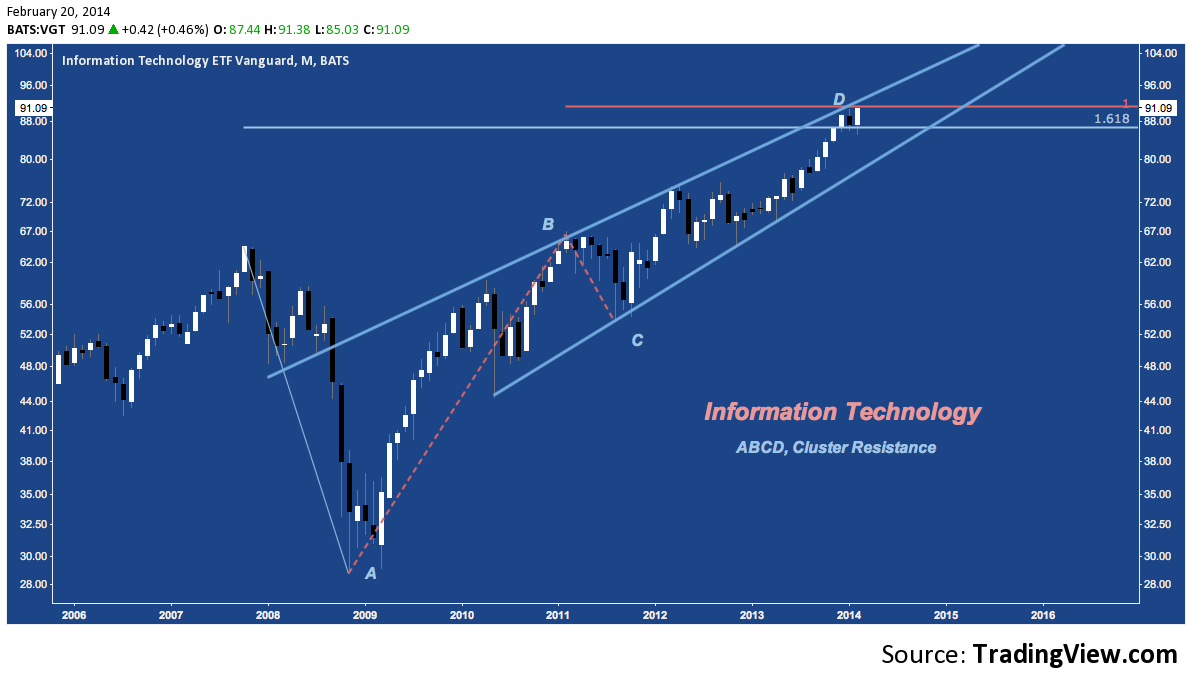
Representing 56.61% of its components, Information Technology is QQQ‘s guiding force. No coincidence then, that the industry (represented here by Vanguard’s VGT) in aggregate is struggling with structured resistance at the top of a familiar-looking 5-year rising wedge:
Information Technology (VGT): 2009-2014 (click image to zoom)
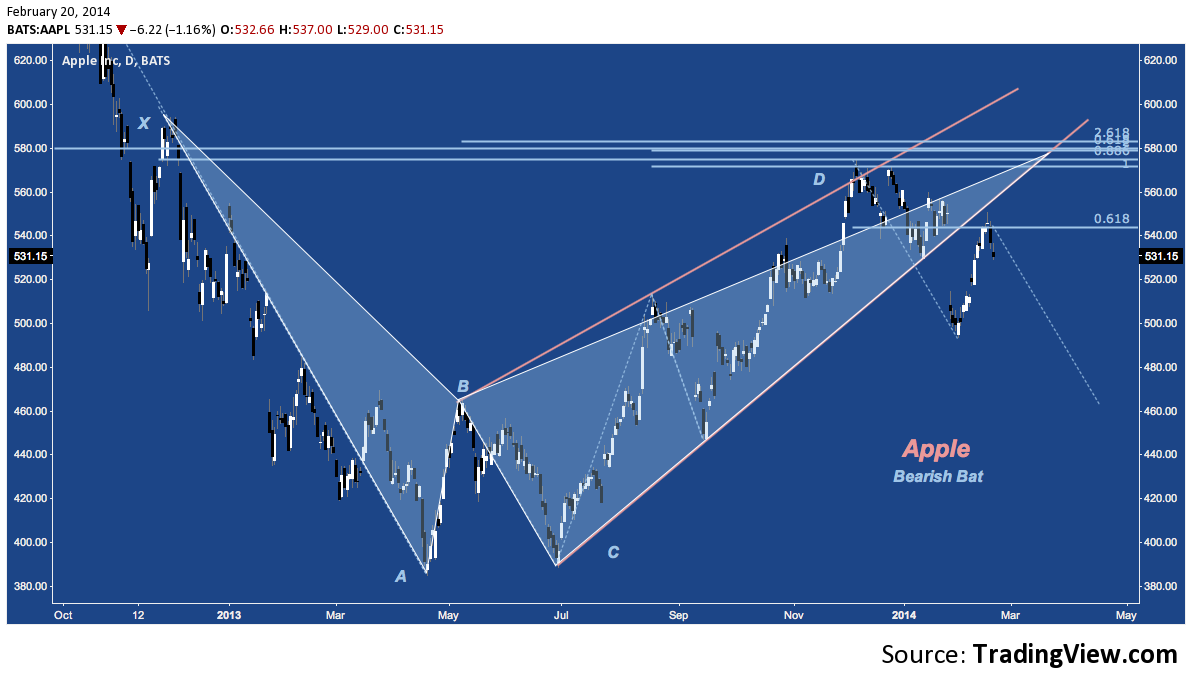
Zooming into the NASDAQ 100’s makeup one step further, Apple (AAPL) makes up 20% of its Information Technology segment and as the largest component comprises 11.57% of the entire index by weight. While stocks like Google (GOOG, at 8.07%) and – as odd as it feels to say it – Microsoft (MSFT, at 7.63%) hold QQQ up, AAPL’s Q3-Q4 2013 recovery has begun to fizzle after meeting 13-month Bearish Bat resistance in December, just as it tagged rising wedge resistance. Mid-way back from its post-earnings lows near $490, Apple remains under pressure.
Apple (AAPL): 2012-2014 – Bearish Bat (click image to zoom)
How about GOOG and MSFT then? With Apple, these stocks comprise almost 30% of QQQ.
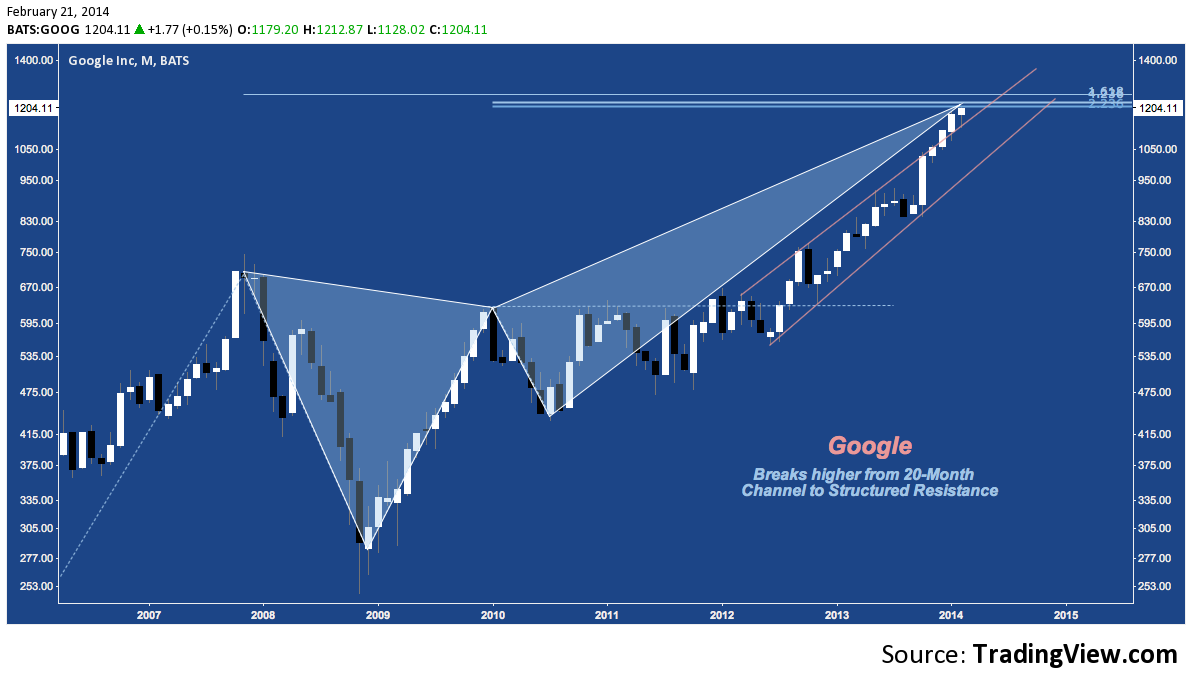
It’s hard to find fault with Google: in affirmation of the scope and fundamental health of their sprawling enterprise, its stock remains in a steep uptrend and is second only to Priceline (PCLN) by share price among QQQ components. That said, even GOOG can get ahead of itself. After 20 months in an already acute rising channel, shares of the tech giant broke higher in December and are now pushing into long-term structured resistance around $1250. February is the 6th consecutive month higher for GOOG, twice matched during December 2008-December 2009 but never exceeded. This doesn’t amount to a “top” call on GOOG – but in the context of NASDAQ 100’s precarious position, it’s worthy of notice.
Google (GOOG): 2007-2014 – Structured Resistance (click image to zoom)
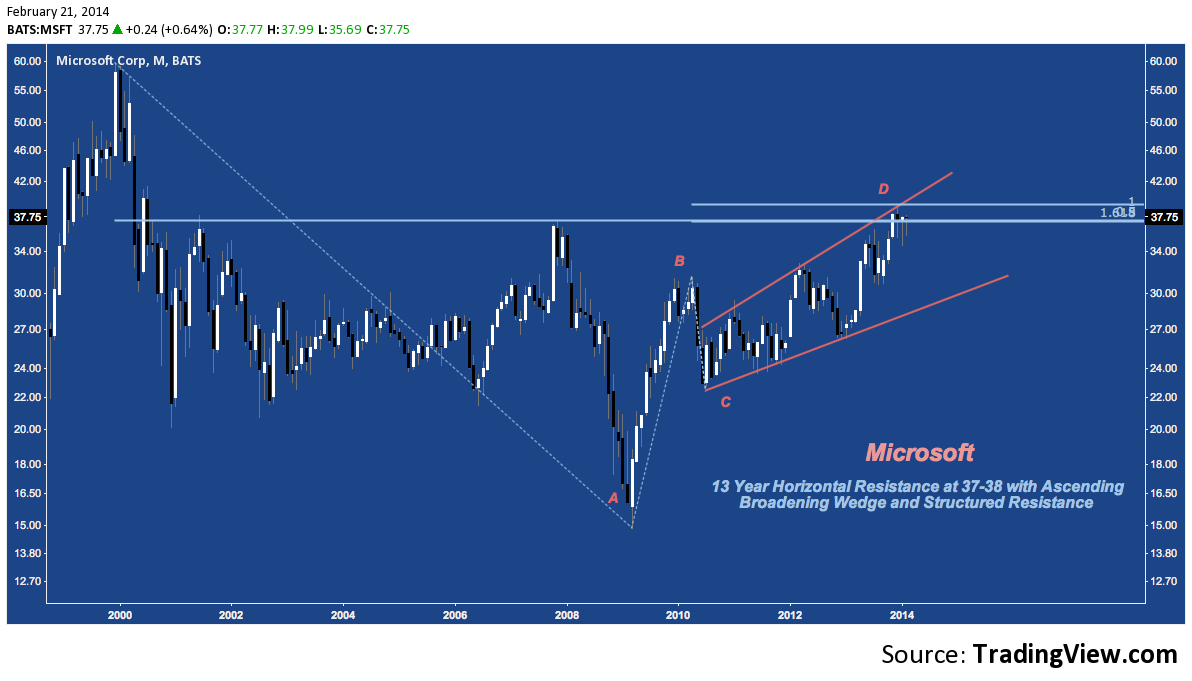
Microsoft moved up sharply in 2013 to resistance set in 2001 and confirmed in 2007 at $37-$38. Momentum suggested this time might be different; but since halting there in November, MSFT has gone sideways. At the same time, the stock is up against ascending broadening wedge resistance (in orange) and structured resistance including a completing ABCD. Though it has lost and recovered to close above $37 for 3 months running, MSFT as made no progress against at resolving this level higher.
Microsoft (MSFT): 2000-2014 – Horizontal Resistance (click image to zoom)
If things are looking more mixed under the hood of the NASDAQ 100 than they have in some time, what about the broader picture?
Thought it looks just like QQQ given a cursory glance, the NASDAQ Composite’s (COMPQ) path since 1999 has created a 14-year Bearish Bat harmonic pattern. In the case of the Composite, “fibonacci cluster resistance” is the Bat’s potential reversal zone (PRZ) between 4050-4350.
NASDAQ Composite: 2000-2014 – Bearish Bat Harmonic Pattern (click image to zoom)
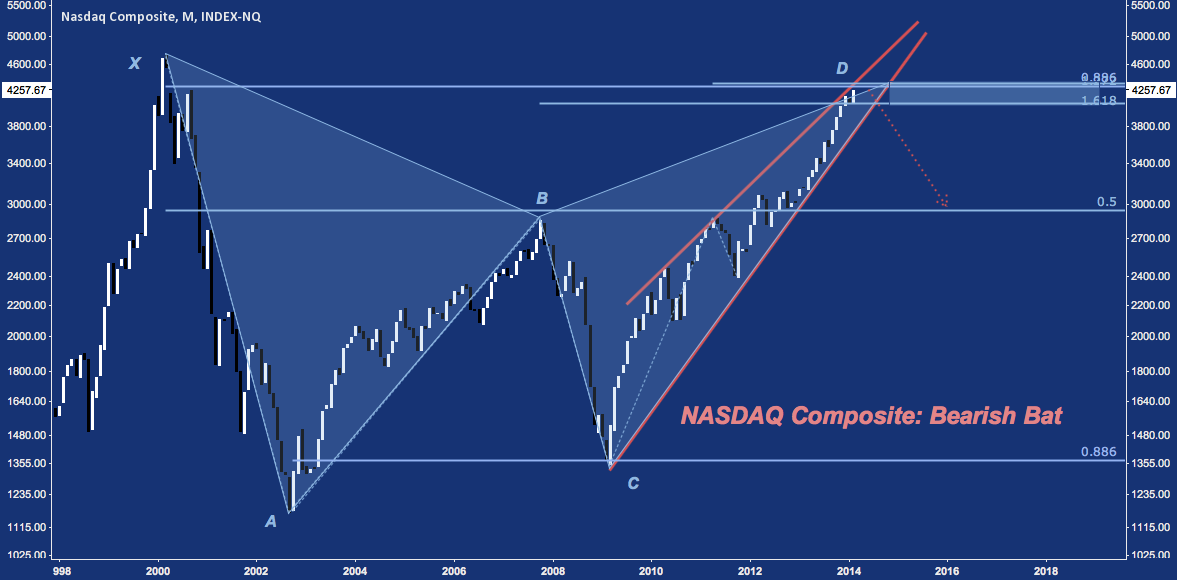
Everything mentioned above about NASDAQ 100’s wedge and ABCD applies here, though COMPQ suggests a much tighter turning point (note, though: these are monthly charts) in a broader market context that is just ahead.
Twitter: @andrewunknown and @seeitmarket
Author holds net short exposure to the Russell 2000 at the time of publication. Commentary provided is for educational purposes only and in no way constitutes trading or investment advice.
“Sleeping Bear” photo by Carol Bock/Minstrel Blue
Any opinions expressed herein are solely those of the author, and do not in any way represent the views or opinions of any other person or entity.
 Rolling Over At Key Fibonacci Level?")


