 By Andrew Nyquist
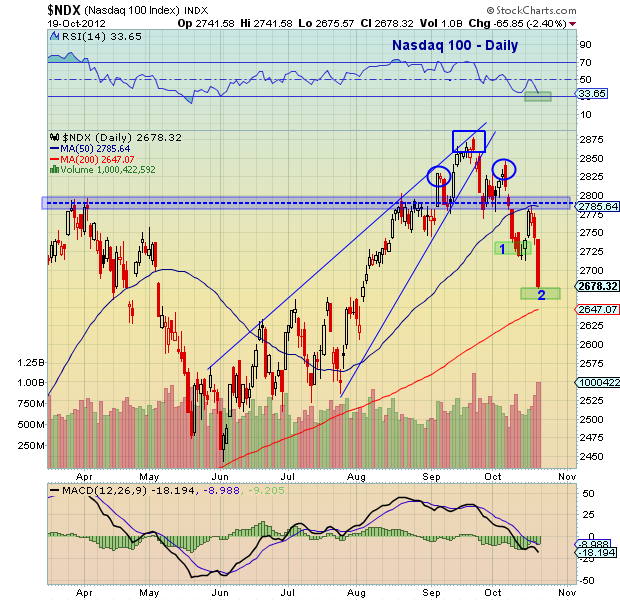
Last week, I provided an update on the Nasdaq 100 technical patterning offering up two likely support targets. The first target was for a ABC measured move, and the second for the head and shoulders breakdown.
A closer look at the current construct of the Nasdaq 100 shows that support may be near. The head and shoulders pattern measures to roughly 2660-2675 and the just below that is the 200 day moving average. As well, the RSI is nearing 30 (a sign that a bounce is near).
It will be interesting, though, to see what Monday brings on the 25 year anniversary of the 1987 crash, especially with such a brutal candle on Friday. Watch Apple (AAPL) as well (Stocktwits update here), as it makes up a good chunk of the index.
Trade safe, trade disciplined.
More charts found here.
Nasdaq 100 (NDX) technical chart as of October 19, 2012. Nasdaq 100 chart with head and shoulders pattern and price target. Nasdaq 100 technical analysis for month of October.
———————————————————
Twitter: @andrewnyquist and @seeitmarket Facebook: See It Market
No position in any of the securities mentioned at the time of publication.
Any opinions expressed herein are solely those of the author, and do not in any way represent the views or opinions of his employer or any other person or entity.


