 By Andrew Nyquist
After outperforming much of the market for first nine months of 2012, technology stocks and their index composites, the Nasdaq and Nasdaq 100, put in intermediate term tops in September 2012. Since that time, neither index has been able to put in new highs. And the biggest laggard has been big tech, sounding caution over a possible Nasdaq 100 divergence. Although many are quick to point out the Apple (AAPL) melt down, and its heavy weighting, its also of note that Apple was a part of the index on the way up and down. And those big cap tech stocks that look healthy now may need a rest, just as AAPL may need its own respite (from selling!).
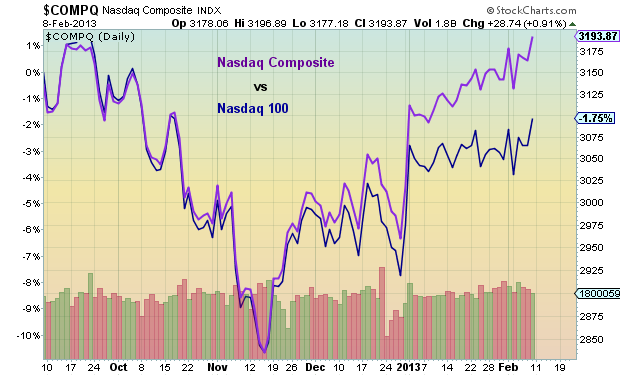
That said, I wanted to dig into the divergence a bit further and point out some important trends and levels to follow. First, let’s look at the trends and divergences. Chart 1 below is the S&P 500 vs. the Nasdaq 100 (brawn vs. brawn). And chart 2 is the Nasdaq Composite vs. the Nasdaq 100.
Chart 1
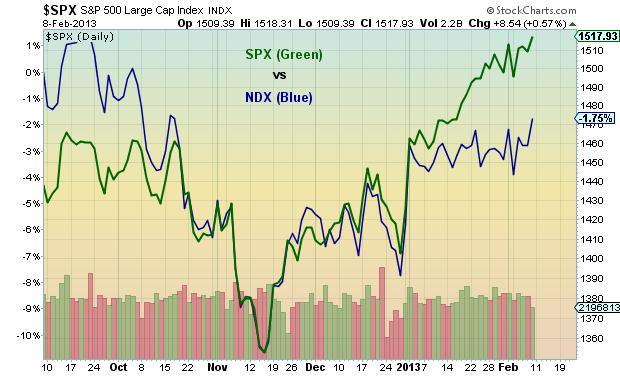
Chart 2
So what are some key levels to watch? Well the most obvious levels to watch for most market observers are the September highs. And although the Nasdaq Composite could reach new highs this week, I am clearly drawn to the Nasdaq 100 divergence scenario. The Nasdaq 100 is over 3 percent off its highs and nearing important resistance. If the index cannot make it through the 2800 level, then it may be signaling a stronger topping signal on the September highs. So, why do I think the 2800 level is so important to the Nasdaq 100 divergence scenario? Two main reasons, both technical:
1) 2800 is the approximate target of a measured, corrective move (A-B-C)
2) Its also near the .764 retracement level (2788).
Nasdaq 100 Divergence – Daily Chart
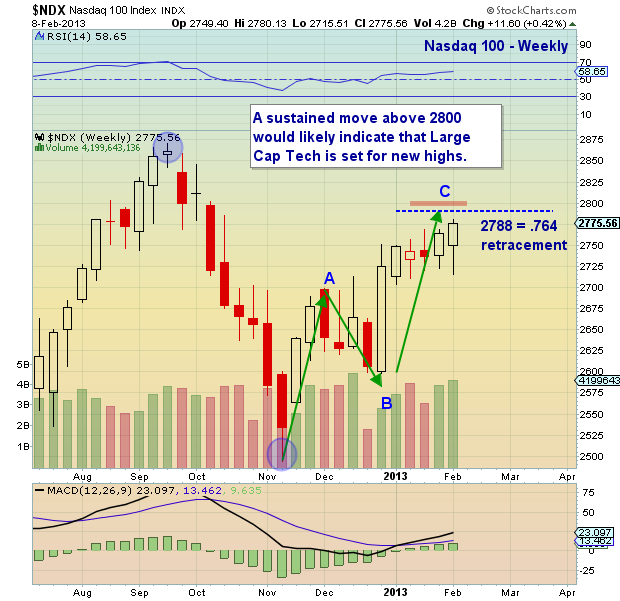
Nasdaq 100 divergence charts highlighting key technical resistance levels.
Twitter: @andrewnyquist and @seeitmarket
No position in any of the mentioned securities at the time of publication.
 Rolling Over At Key Fibonacci Level?")


 Rolling Over At Key Fibonacci Level?")