2014 continues to build it’s reputation as a year full of counterintuitive market dynamics: Q2’s zombie volatility has (finally?) subsided – just as the seasonal period known as the Summer Doldrums is scheduled to kick in.
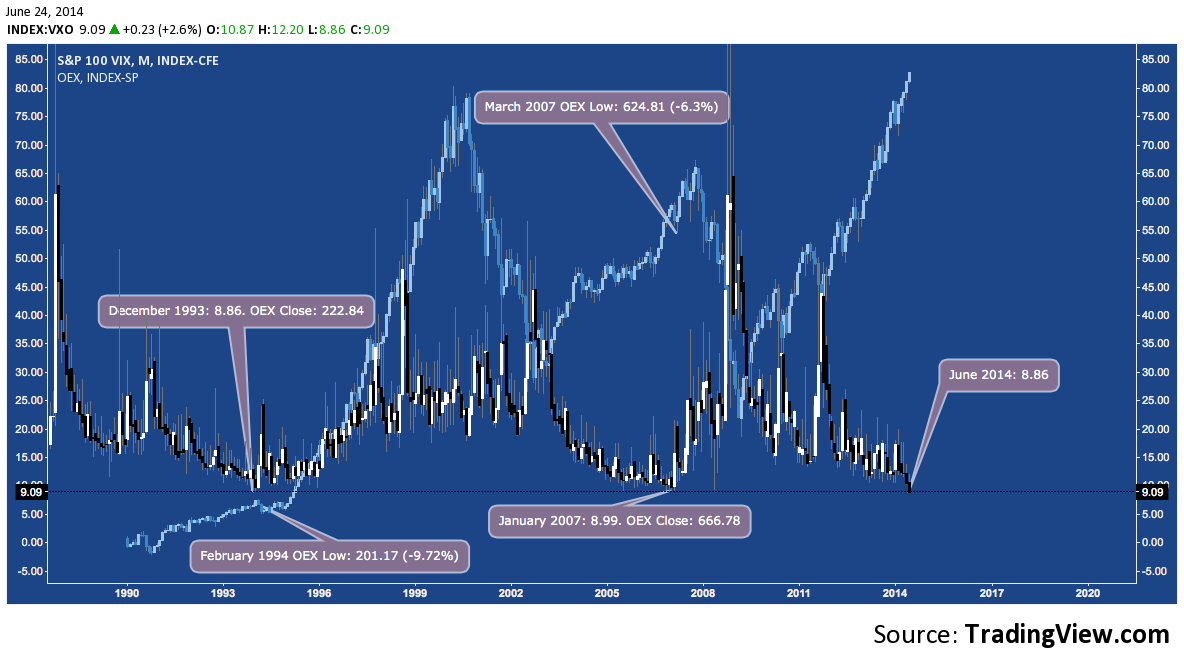
Some of the shine has come off broad momentum trades active investors have piled into such as High Yield Corporate Bonds (HYG), Semiconductors (SOX) and Biotech IBB). Despite positively-received Q2 Earnings, Major Regional (KRE) and Large Money Center Banks(BKX) can’t find a sustained bid. Meanwhile, the much-reviled 30-Year US Treasury Bond (ZB) closed Friday at YTD highs. And it looks like that record low on S&P 100 implied volatility (VXO) in late June did signal a more active market ahead – just as it did in December 1993 and January 2007. Nonetheless, realized volatility in many instruments across every major asset class remains at multi-year (and in some cases, all-time) lows.
Let’s dare to hope markets are becoming more active again after what looks in retrospect like a 7-month sleepwalking momentum consolidation of 2013’s outlier year. Entertaining that notion for a moment, here are several (50) charts reviewing where many (alas, even 50 is nowhere near comprehensive) major markets are, beginning with the S&P 500 (SPX); and some notes on what to expect as directional opportunity returns.
(Caveat Lector: there are no charts VIX, VXST, VXO, VVIX, TVIX, VXX, VXZ, VXV, SKEW or any of the myriad other volatility products below – mostly because this is being done by many market watchers elsewhere – and even well, by a few. Wherever impending volatility pickup is alluded to below, it’s in reference to Bollinger Bandwidth (BBW) or simply the implied – if not guaranteed – pop in volatility inherent in price through resolving chart patterns).
Is the S&P 500 out of the woods after Friday’s bounce? At its 5-year Rising Wedge Apex and 7-year Bearish Butterfly Potential Reversal Zone (PRZ), it may just be walking into them.
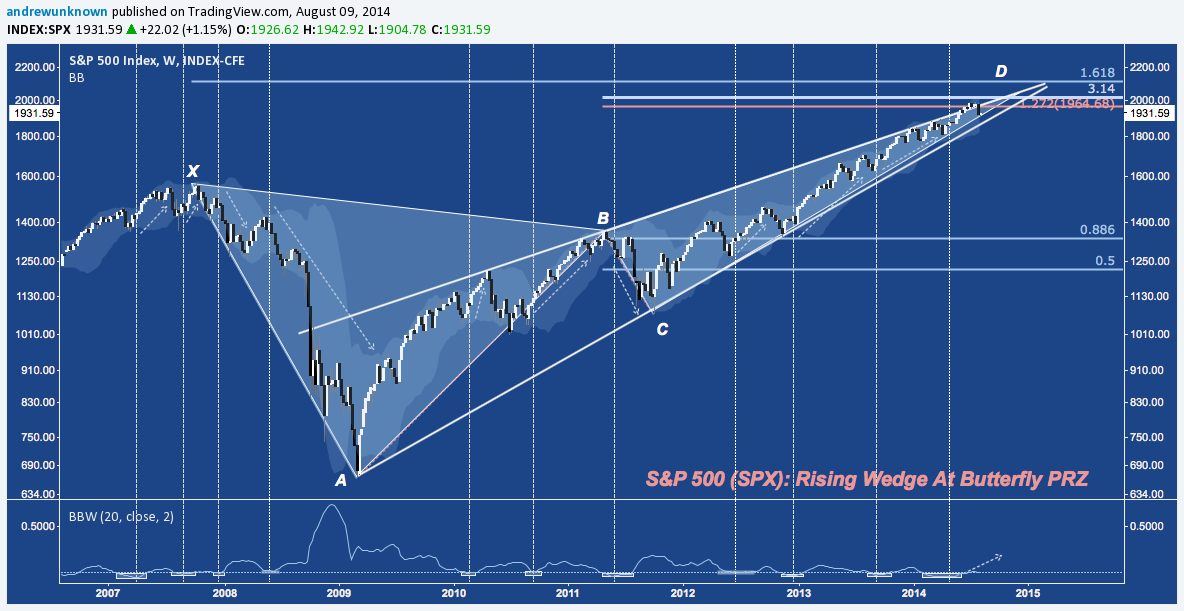
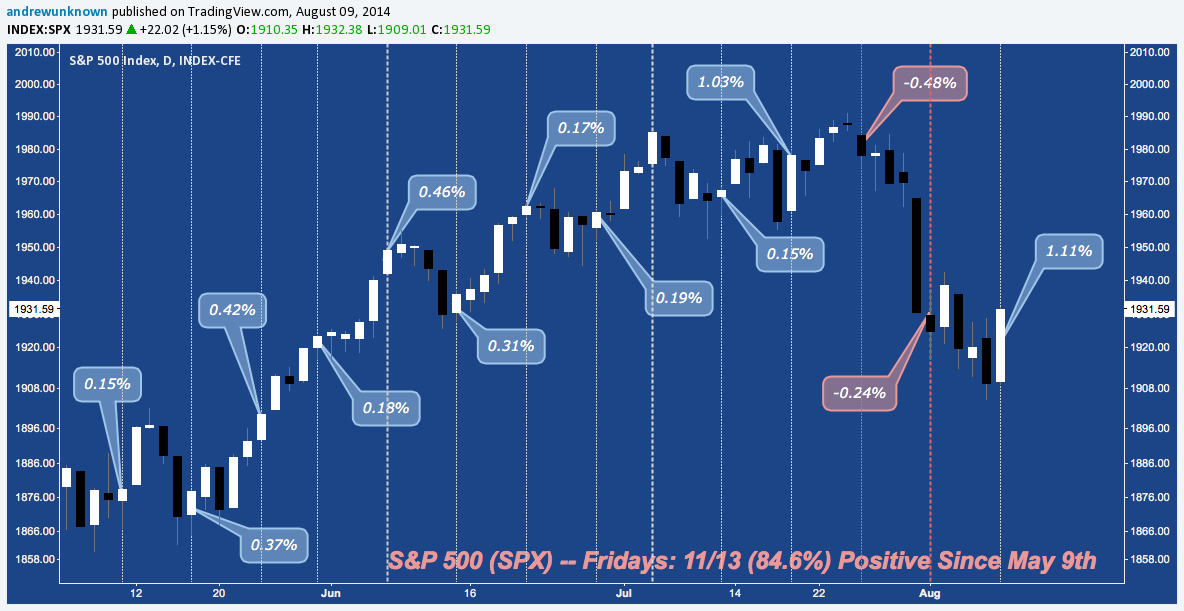
In this context, however, many of recurrent themes that have characterized the last 18 months of the cyclical bull market continue. Case in-point: like last year, weekday cyclicality has shifted from Tuesday as the session that does not close down to Friday. The last 11 of 13 Friday’s have finished higher, with last Friday the second best performer of the year at 1.11% – just behind 02/07/2014’s 1.33% gain, near the bottom of February’s 21-session, +8.3% run.
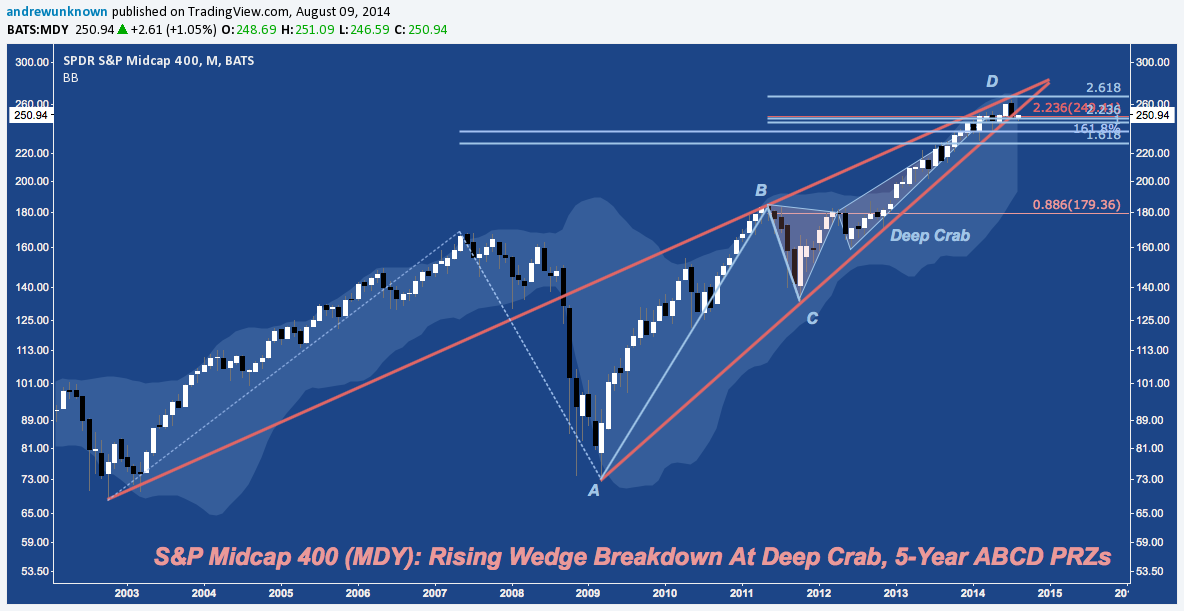
Midcaps (MDY) snapped their 5-year Rising Wedge in the last week of July, return to 3-year Bearish Deep Crab resistance (at D) on Friday where it the index found tentative support.
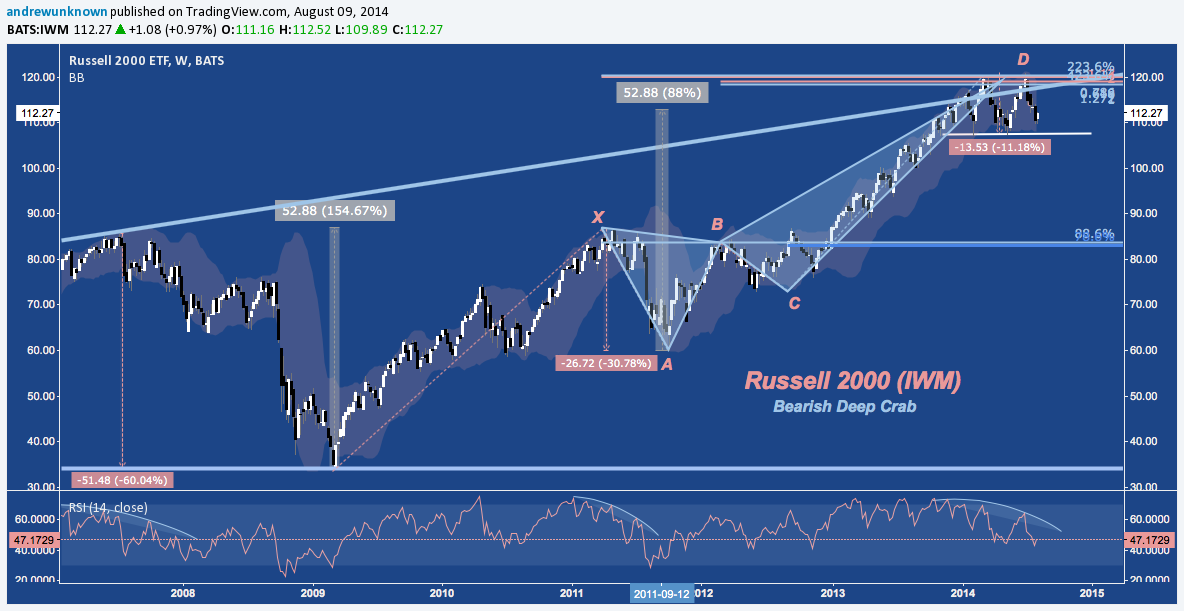
Small Caps (IWM) continue to markedly underperform their larger cap peers YTD with 2 major rejections at structured resistance near 120 and rising channel resistance with a massive momentum divergence slowly pulling the rug out beneath: 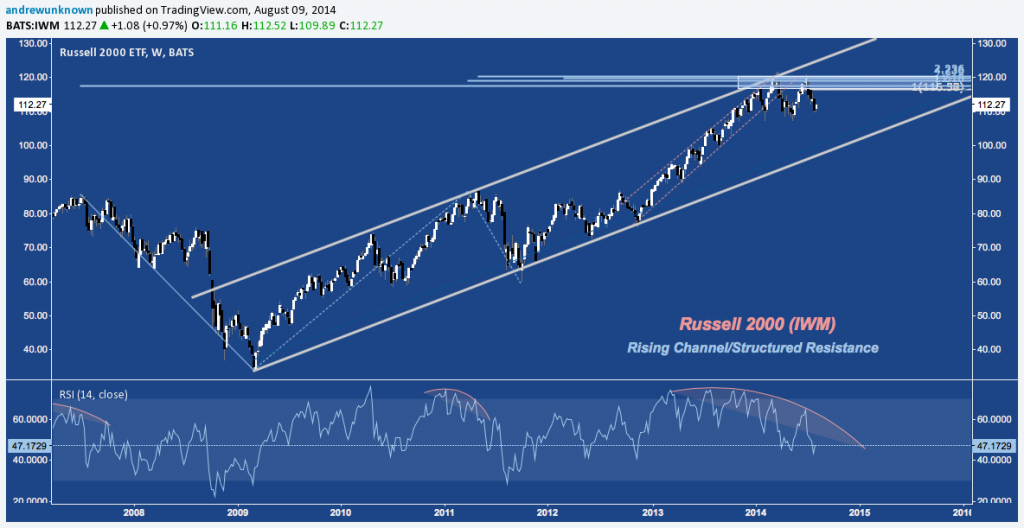
Russell 2000 (IWM) is faltering at a Bearish Deep Crab PRZ of its own. From high to low, IWM has corrected -11.2% YTD, forming a potential double top after two sustained-but-unsuccessful attempts to break secular trend line resistance near 120. R2k has been highly active inside 2014’s 12% consolidation range, but all activity amounts to nothing more than noise for the primary trend until 107 or 120 breaks.
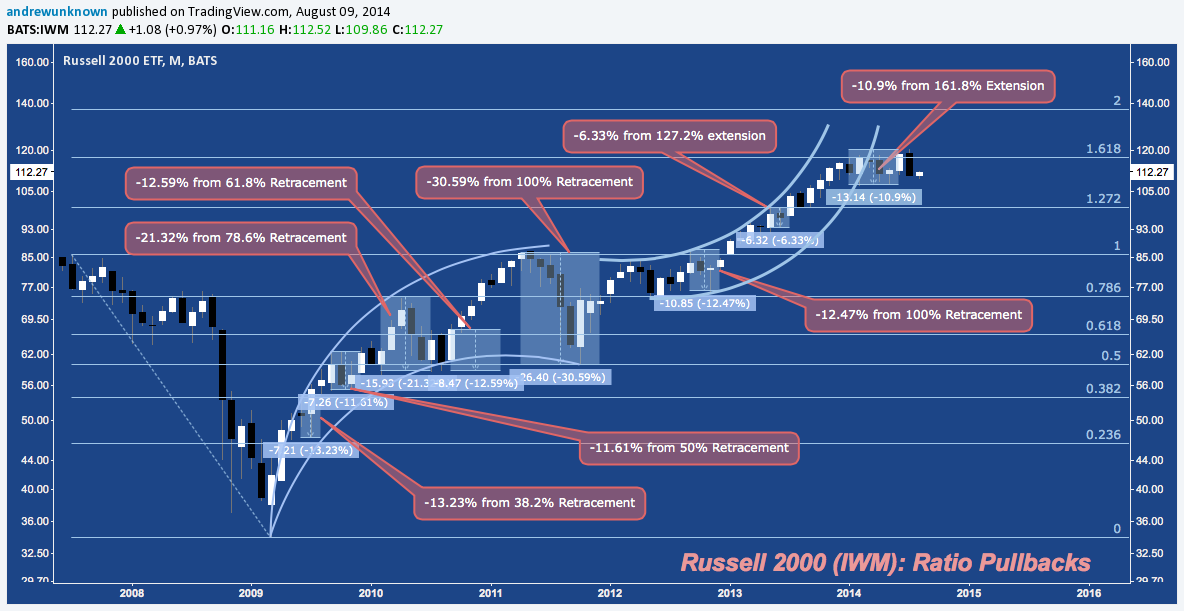
Russell 2000 (IWM) continues to react closely to fibonacci retracement and extension levels generatedby 2007-2009’s decline. The current consolidation is occurring just below the 2007-2009 161.8% fibonacci extension and at -11% is second only to mid-2013’s -6.3% decline as the smallest ratio pullback of the cyclical bull.
Since 2000, Russell 2000 (IWM) ever major technical event has occurred in intervals of 26 points. 2014’s rangebound behavior has occurred between secular trend line resistance and the latest of these levels, 26 points above the horizontal breakout over 2007, 2011 highs near 86 in early 2013. Is this a “consolidation fulcrum” like 2004-2005 and 2010? Or a major top, like 2000 and 2007? This pattern’s (limited) cyclicality – ever 4-5 years and every 7 years – suggests either is possible.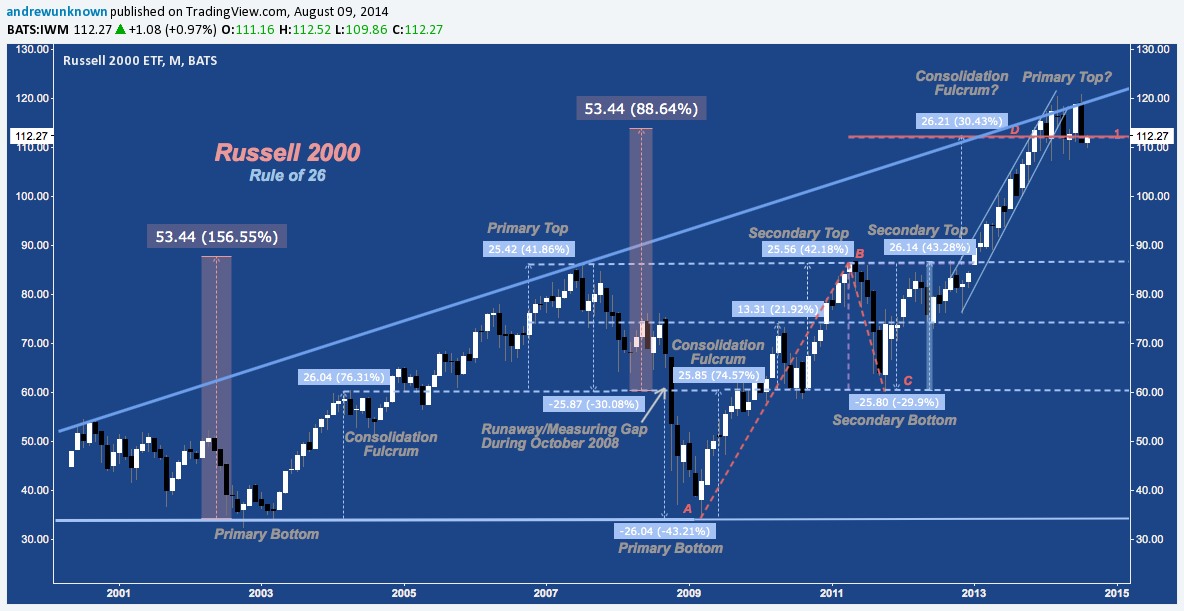
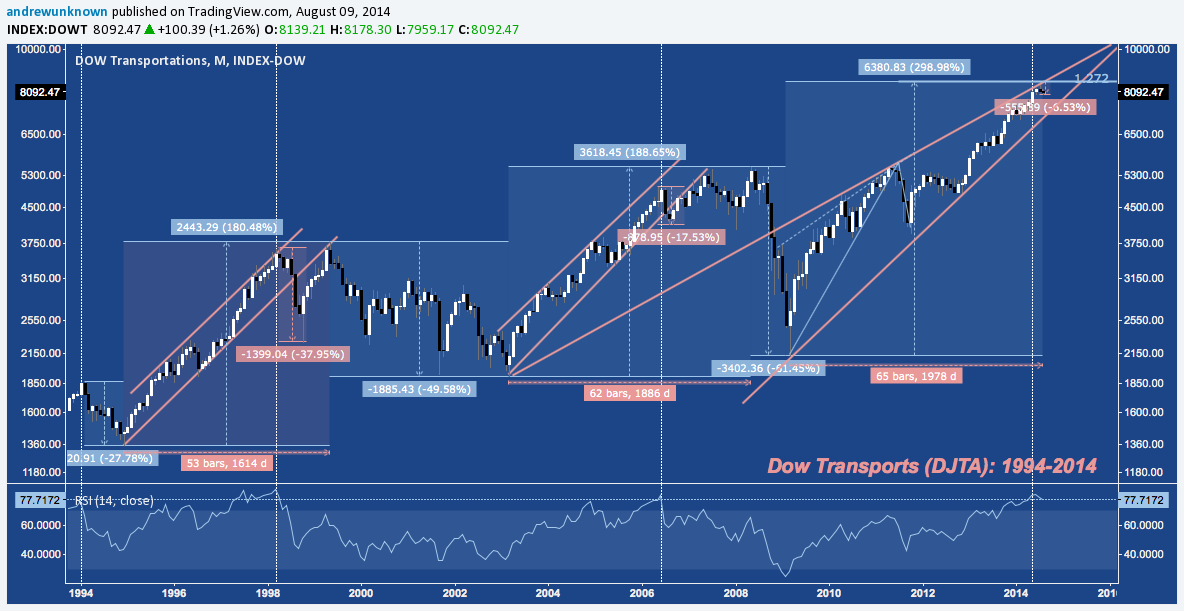
Dow Transports (DJTA) touched Rising Wedge trend line resistance weeks ago and has since corrected -6.5%, forfeiting a small fraction of its 300% gain since March 2009’s low. Transports are as consistently overbought as they’ve ever been with an uptrend that matches the late 1990s with it’s aggressive range and relentless momentum. 1998 and 2006 are important precursors here: like 2014, both tagged a monthly RSI above 80 near/at channel resistance. Both then broke down aggressively, shedding -38% and -17.5% respectively and losing their channel trajectories. Each time, DJTA rallied in an aggressive throwback to channel support-turned-resistance, making a nominal higher high before dropping into deep bear market. If a similar scenario is about to play out, Transports will lose their rising wedge near 7200, then rally to make a nominal new all-time high before rolling hard.
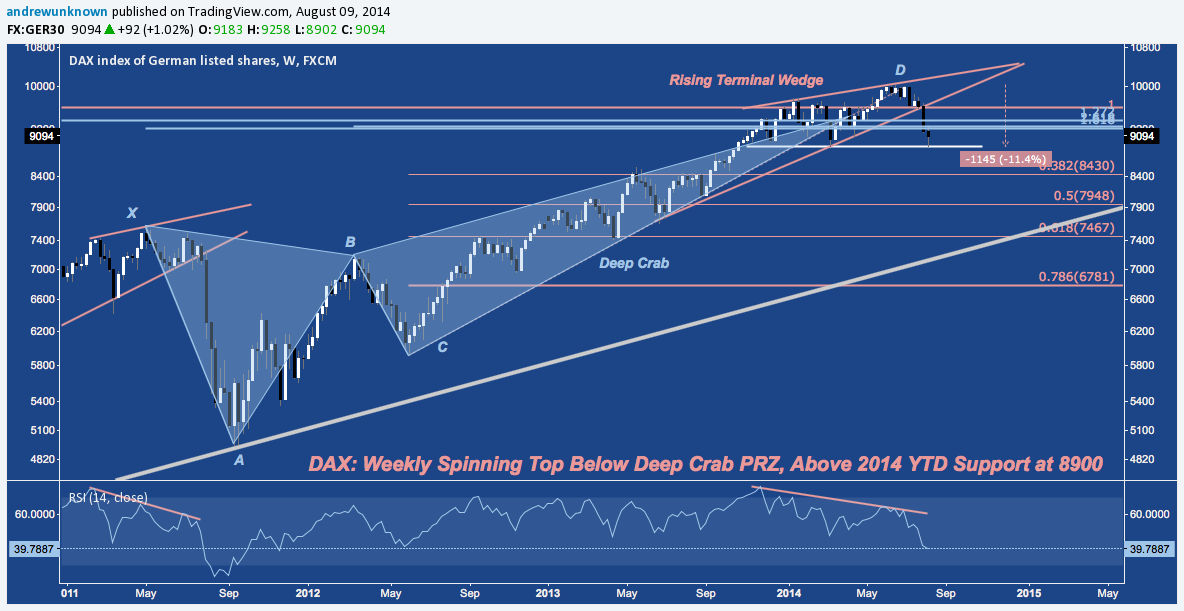
The German DAX has broken below 2014’s Rising Wedge and through it’s Deep Crab PRZ in the last two weeks, dropping into official “correction” territory. Falling as much as -11.4%, DAX is in marked contrast to the -4.3% decline (at it’s worst Thursday) off all-time highs the S&P 500 has suffered in July/August. DAX is now at it’s most oversold on its weekly chart since October 2011. 2014’s year-to-date horizontal support lies just below at 8900.
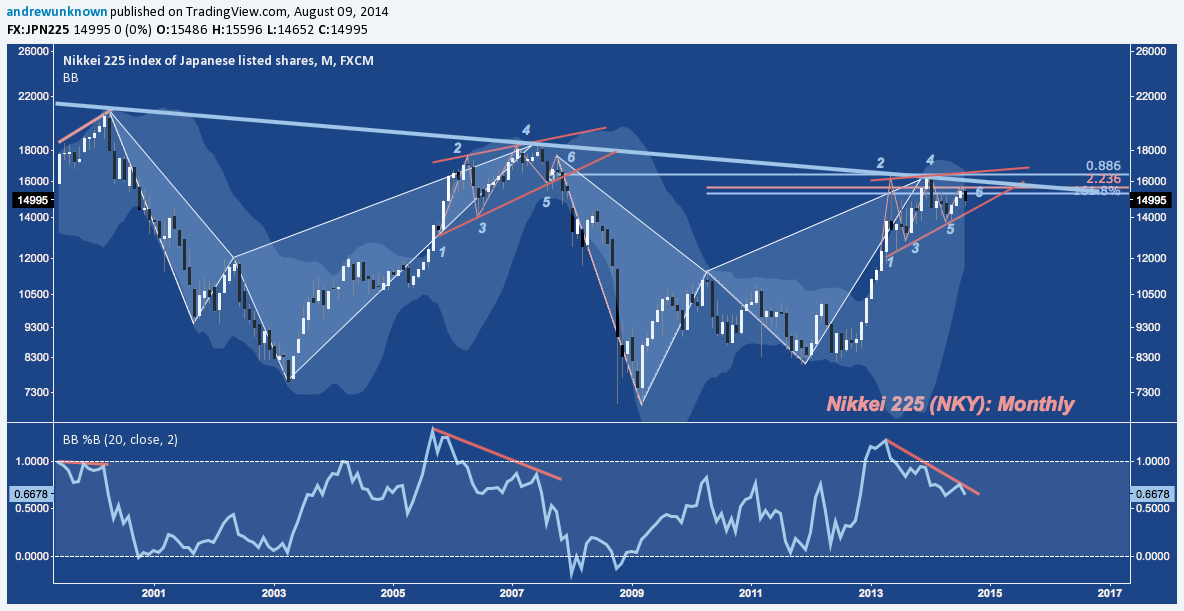
Japan’s Nikkei225 (NKY) is playing out with great fidelity to 2006-2007’s terminal rising wedge at secular descending trend line resistance. Notice the partial rise to wedge resistance at “6” in 2007 on a huge negative momentum divergence for breaking lower. So far, 2013-2014’s wedge sequence at the same trend line is rhyme closely.
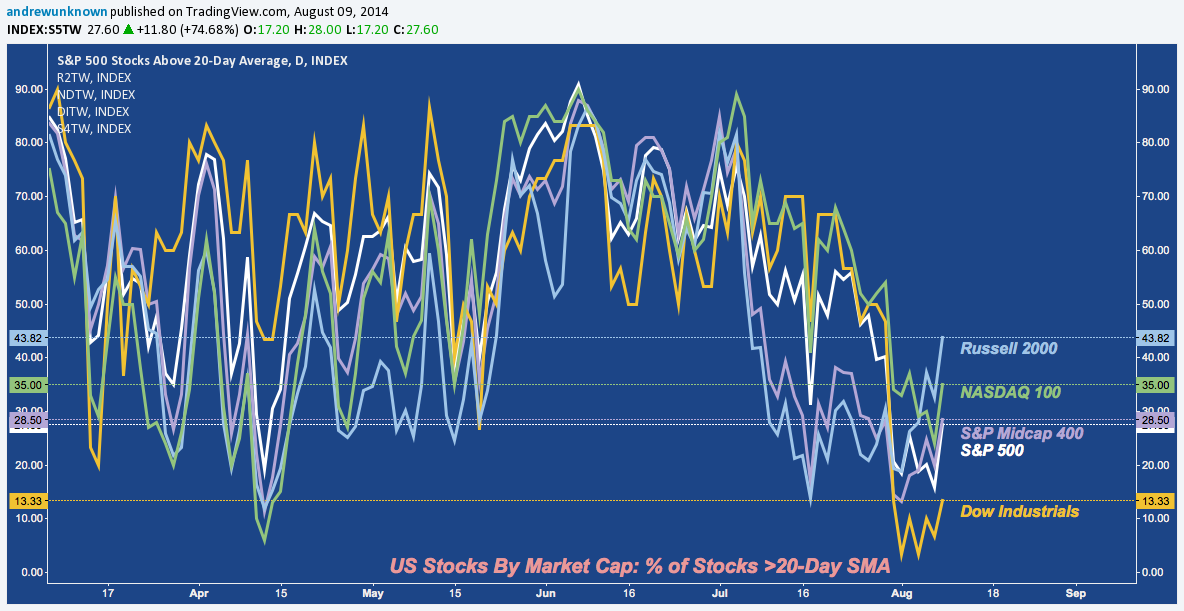
The next four charts evaluate US equity trend participation by comparing the percentage of stocks trading above key moving averages across Mega (DIA), Large (SPY), Mid (MDY), Small (IWM) Caps, along with NASDAQ 100’s (QQQ):
% Stocks Trading >20-Day Simple Moving Average (SMA) Across US Equity Market Caps:
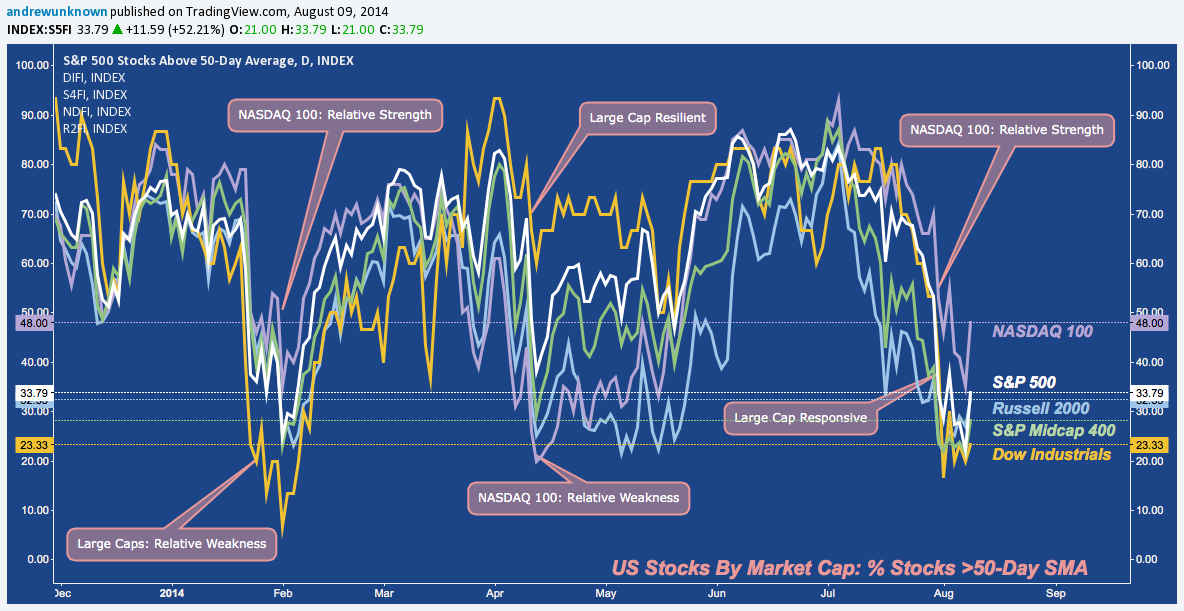
% Stocks Trading >50-Day Simple Moving Average (SMA) Across US Equity Market Caps:
% Stocks Trading >20-Day Simple Moving Average (SMA) Across US Equity Market Caps:
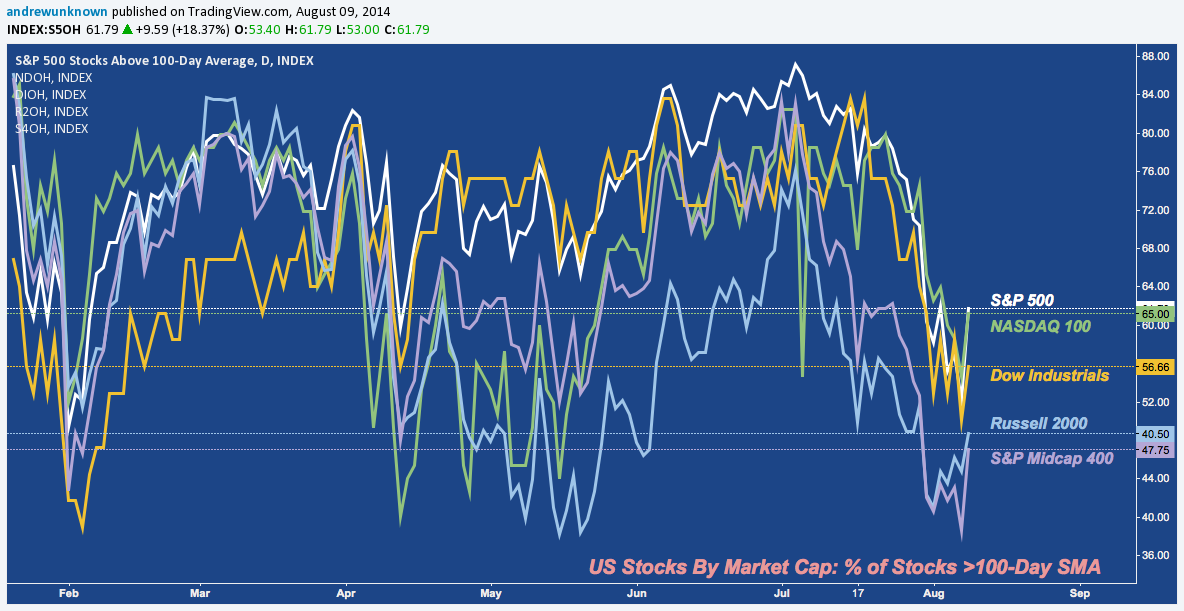
% Stocks Trading >200-Day Simple Moving Average (SMA) Across US Equity Market Caps:
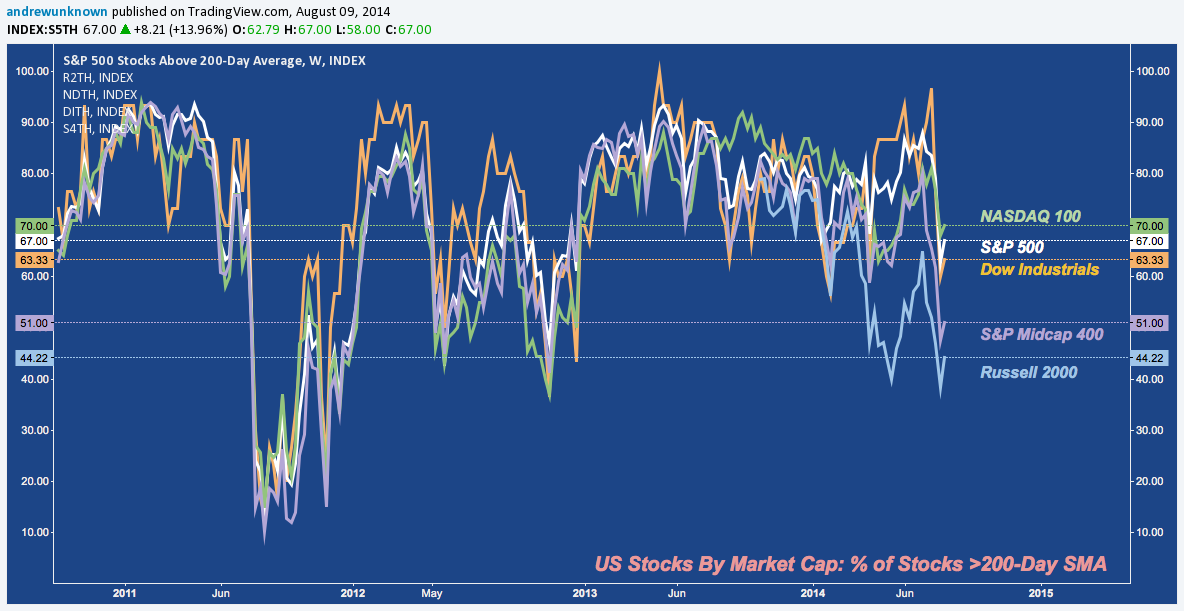
The variation between market caps in the longer moving average studies – particularly the 200-SMA – affirms this is the most trying period for US stocks since 2012, illustrating well what an exceptionally quiet environment 2013-2014 has been overall and that the current pullback is still modest in terms of the underlying technical damage indices have sustained even in lesser selloffs of the recent past, such as Spring and Fall 2012. It’s important to acknowledge this as risk managers working to sidestep the recency bias that 2013-2014 has engendered about what a “pullback” or “correction” ought to look like, remembering that market regimes change and volatility is relative to each.
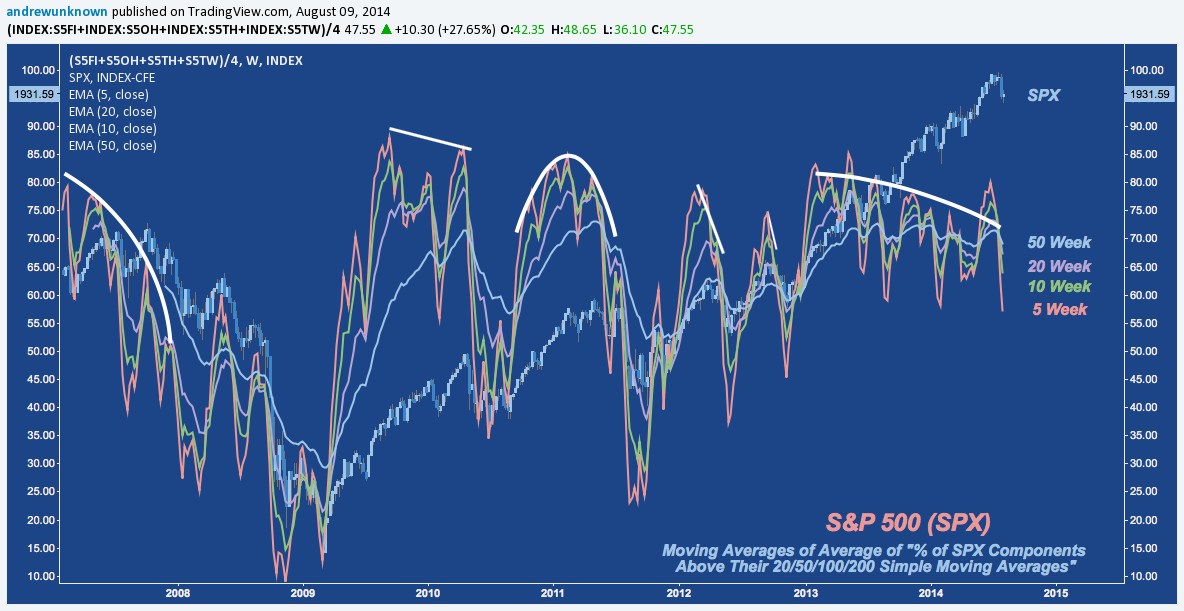
Below I pull these disparate values together for the S&P, averaging them and then smoothing that average with 5, 10, 20, and 50 week EMAs to get a smoothed-out composite of S&P 500 participation. According to this view, SPX constituents are predictably near 2013-2014 lows; but the 5 major divergences preceding it in the last 7 years (2007, 2010, 2011, Spring 2012, Fall 2012) demonstrate these measures can and do drop much further than 2013-2014 YTD suggest.
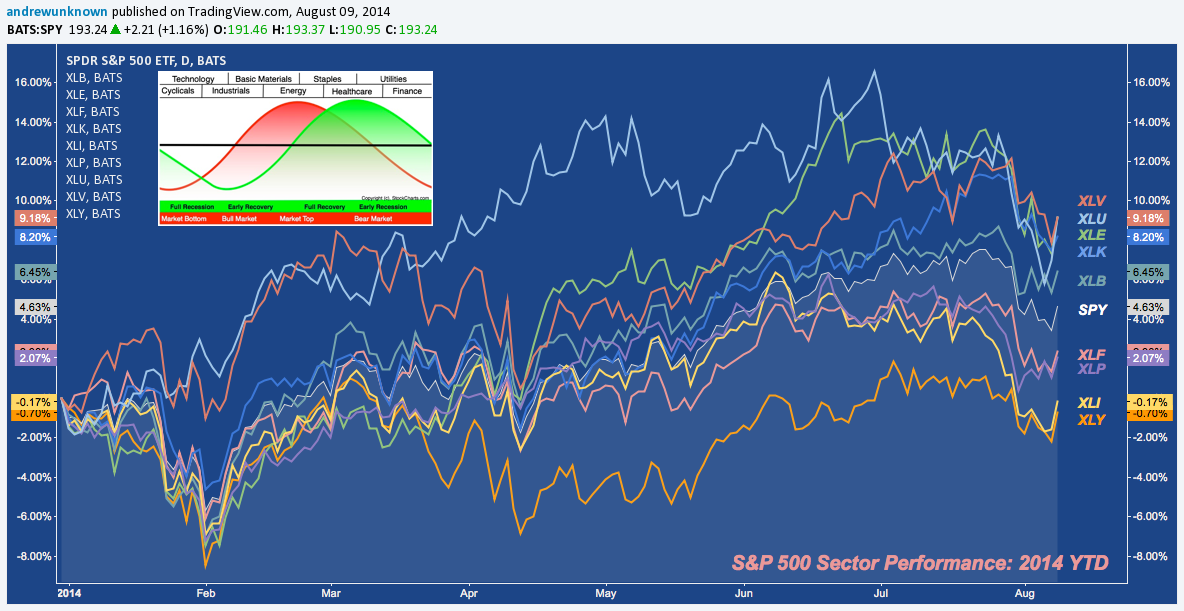
S&P 500 Sectors continue their defensive orientation with peak (XLE) and countercyclical (XLV, XLU) topping year-to-date performance. Meanwhile, key pro-cyclical sectors such as Financials (XLF) Industrials (XLI) and Consumer Discretionary (XLY) are underperforming signficantly. Is this post-peak sector orientation? The appended chart is instructive on this point.
Here are S&P 500’s constituent sectors in order. Notice their structural similarities with the overarching index at it’s own potential reversal zone near 2000.
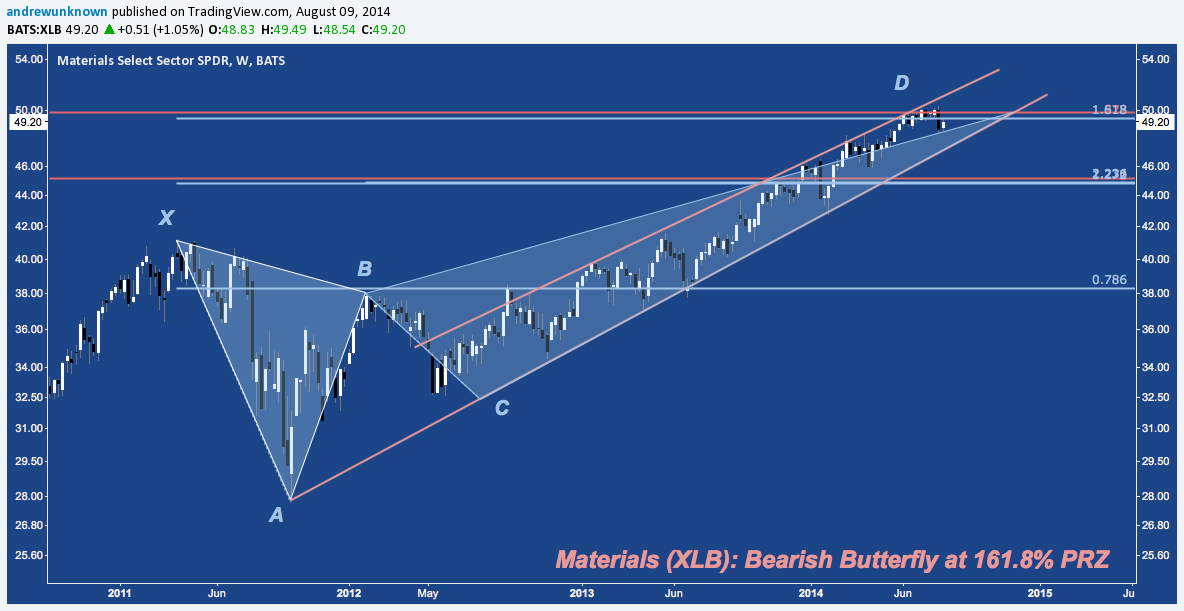
Materials (XLB) continue their struggle at 3.5-year Bearish Butterfly resistance:
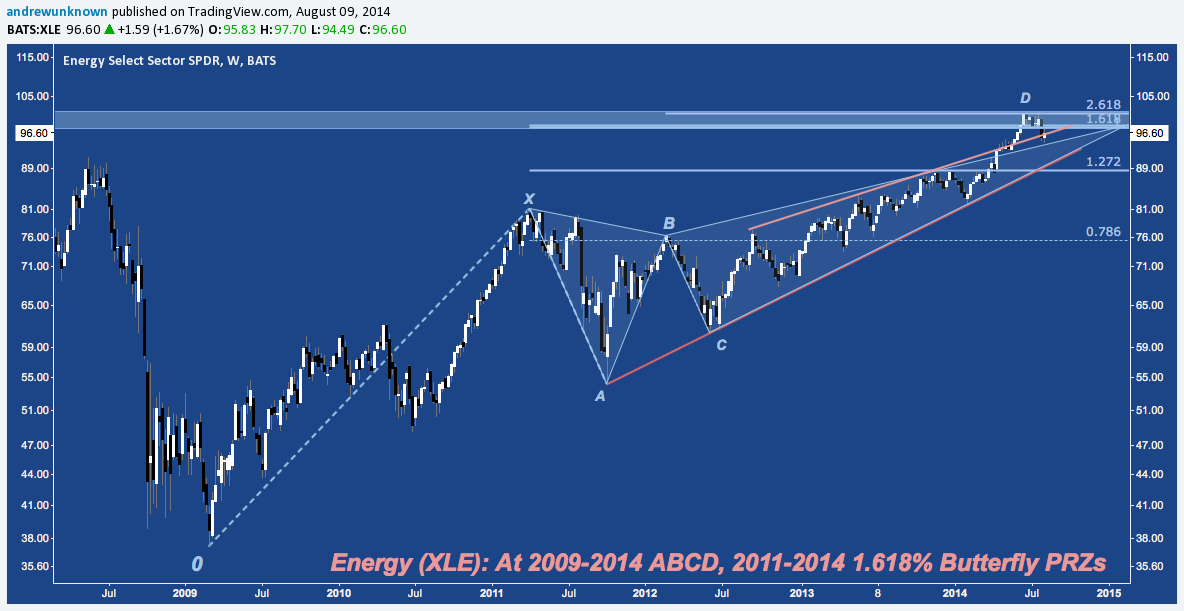
Energy (XLE) is wrestling with 3.5 year Bearish Butterfly resistance, in confluence with the primary target of the ABCD pattern playing out since the 2009 bottom:
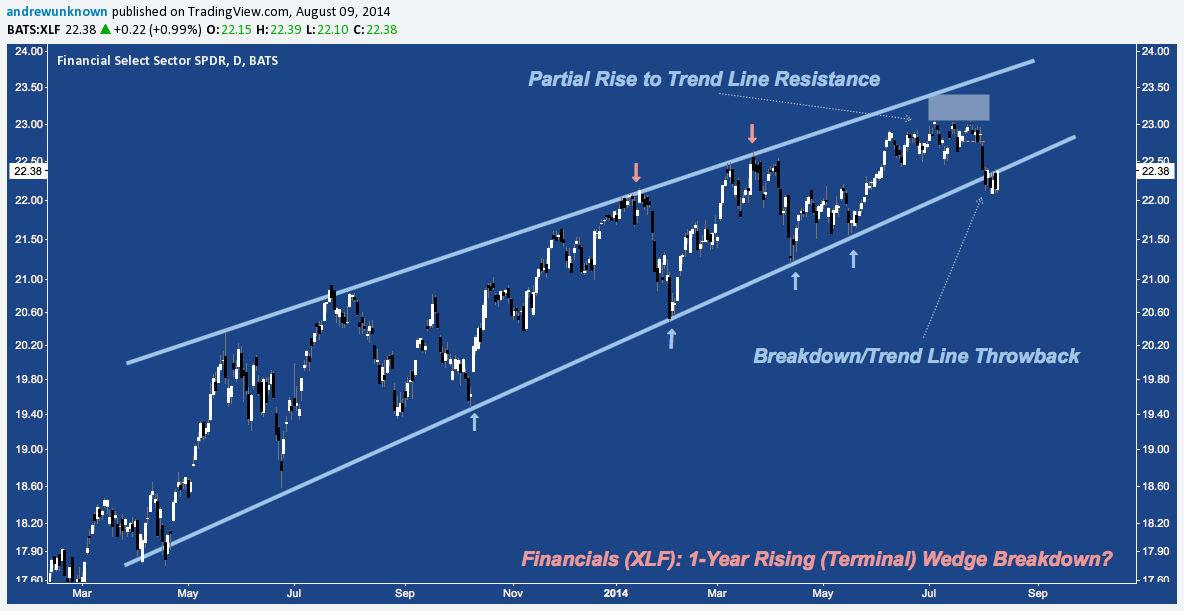
Financials (XLF) have a major multi-year harmonic pattern culminating near $22 (not pictured). At it’s Potential Reversal Zone (PRZ) lies this 18-month Rising Wedge. This pattern broke trend line support at the end of July, then lingered below all last week before rallying to close on the line Friday. The upcoming week will answer whether this is a throwback only (which will then turn lower) or will build into a failed wedge breakdown for Financials.
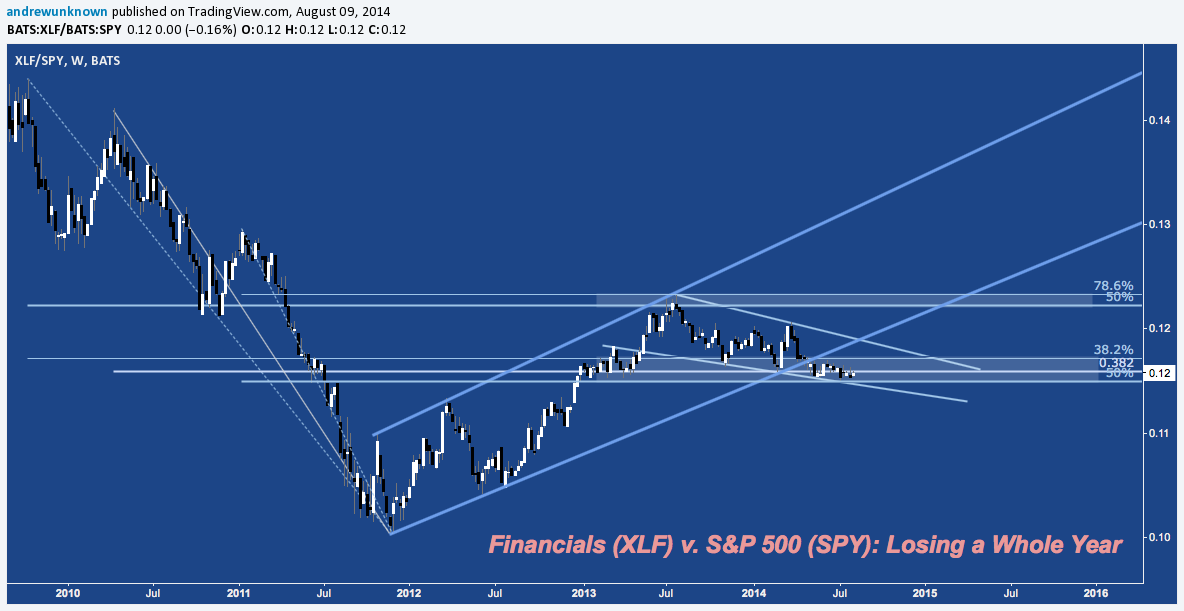
The general and persistent underperformance of Financials (XLF) v. S&P 500 (SPX) is a point of continued concern for the ongoing viability of the cyclical bull:
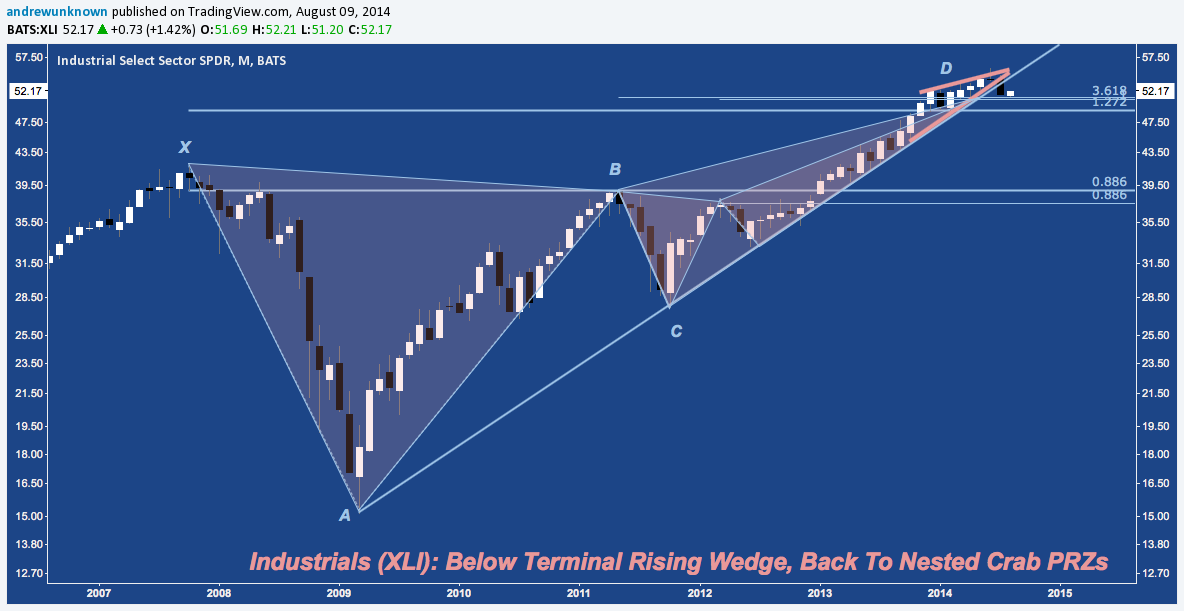
Industrials (XLI) has rolled out of it’s own terminal Rising Wedge, returning to the nested Deep Crab reversal zones it struggled with and ultimately broke higher from in Q1. Note that primary ascending trend line support (originating at the 2009 low) broke in July with no attempt to recover it staged yet.
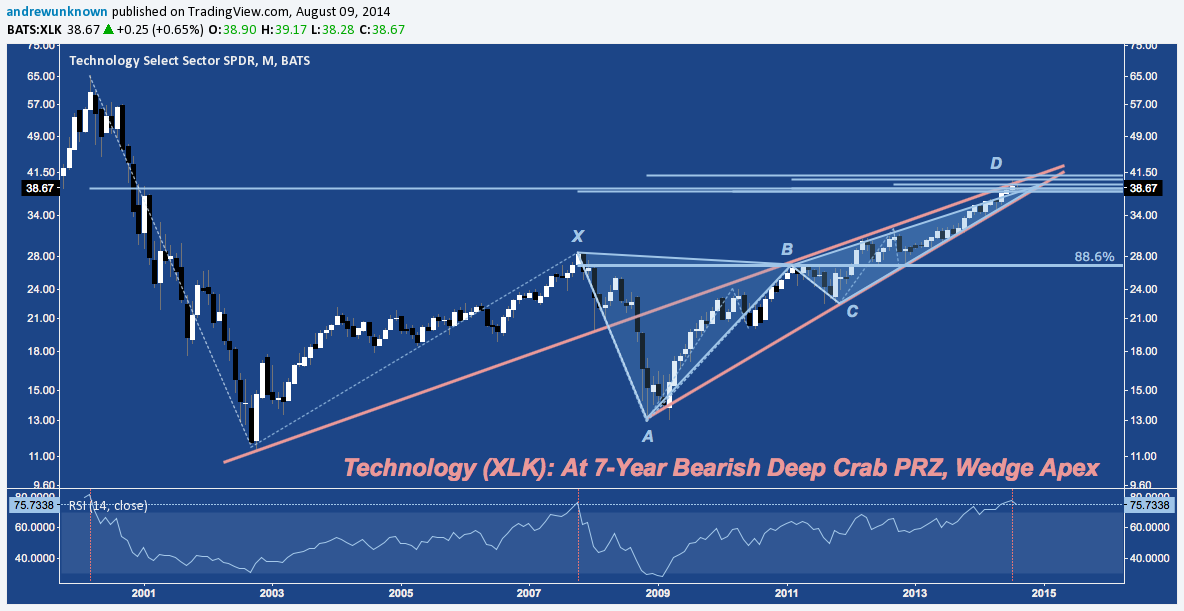
Though it’s faring much better in the near-term, like Industrials Technology (XLK) is also at 7-year Bearish Crab and additional structured resistance (at D) near $38-$39:
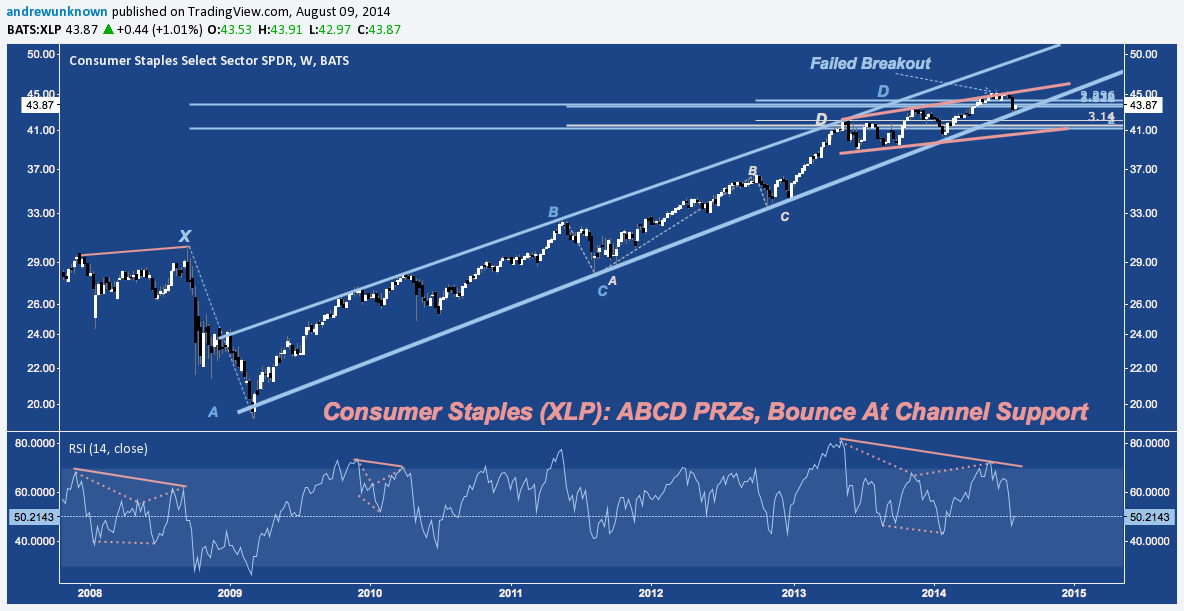
Consumer Staples (XLP) has been grinding higher but overall is net flat since early 2013. Following June’s failed breakout above rising channel (orange) resistance the sector is now testing 2009-2014 channel support at $43-$44.
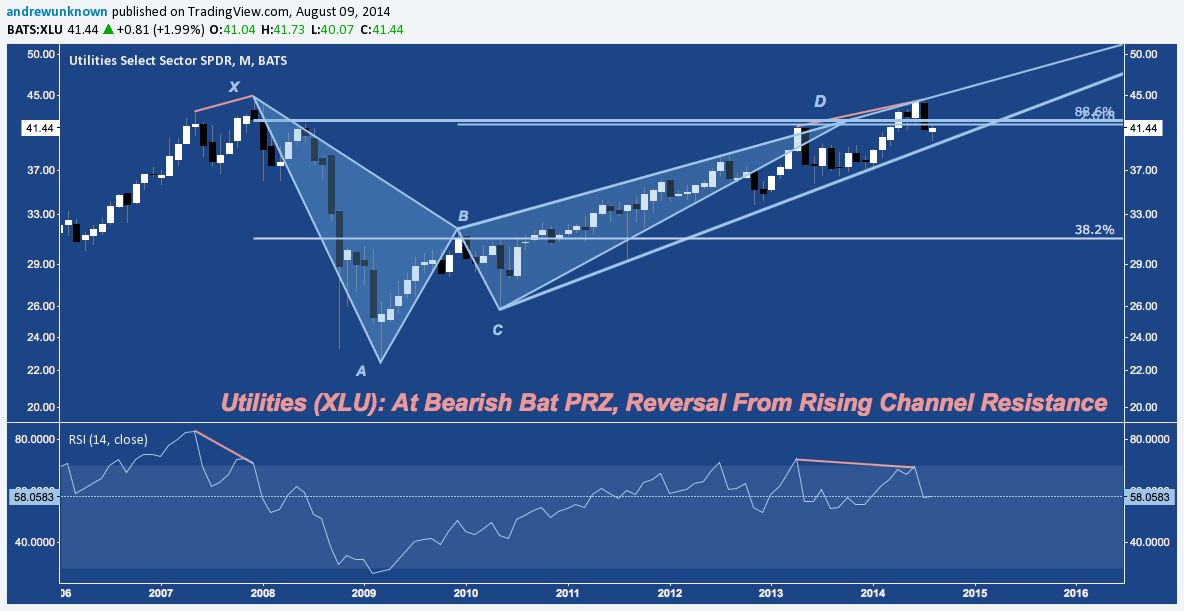
Utilities (XLU) bounce at 4-year Rising Wedge support last week to start August off on a strong note; but the sector remains below 7-year Bearish Bat resistance nar $42-$43.
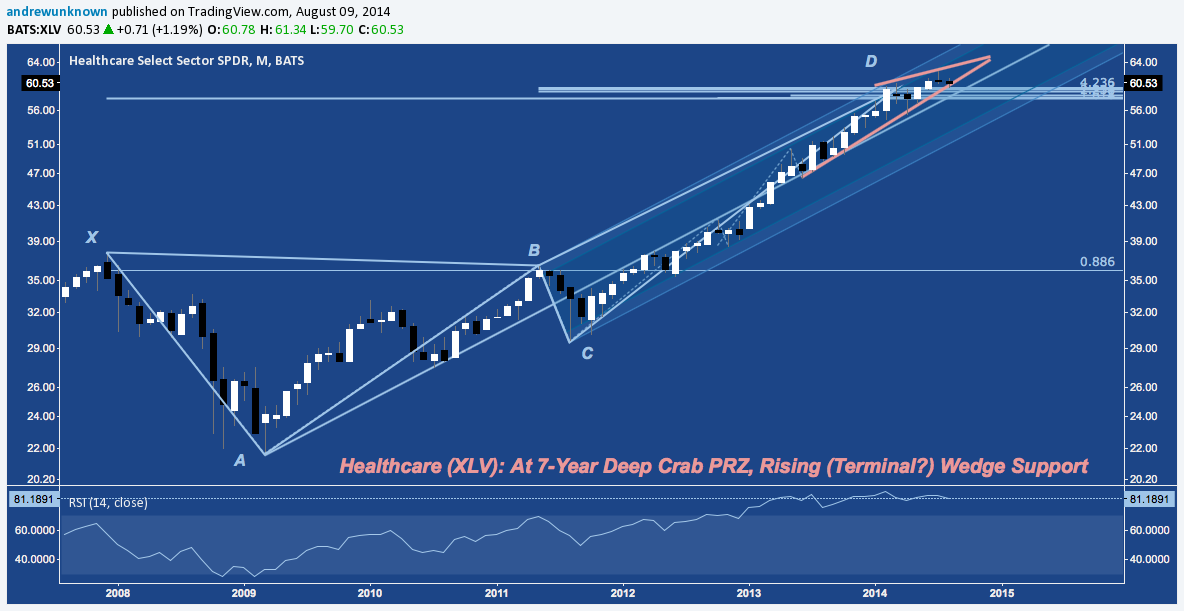
Healthcare (XLV) is balancing on Rising Wedge support, just above resistance (turned support?) from it’s own 7-Year harmonic pattern:
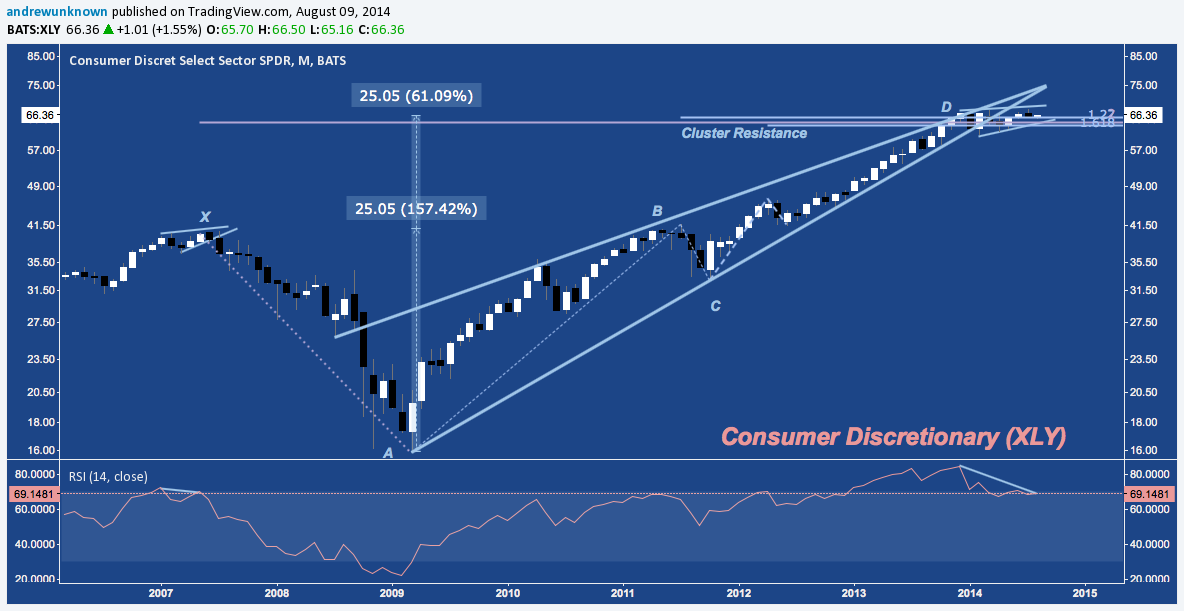
Consumer Discretionary’s (XLY) is winding out a Rising Wedge at major multi-year harmonic resistance just like it’s peers. Here, it’s at cluster resistance given off by 2009-2014’s ABCD pattern, and at the measured move objective of XABC’s Cup w/Handle pattern. The wedge consolidates XLY’s leading 2013 sector performance: does it portend another leg higher, or is it setting up on a negative momentum divergence as it did at X?
That’s the S&P. Here are some individual industries:
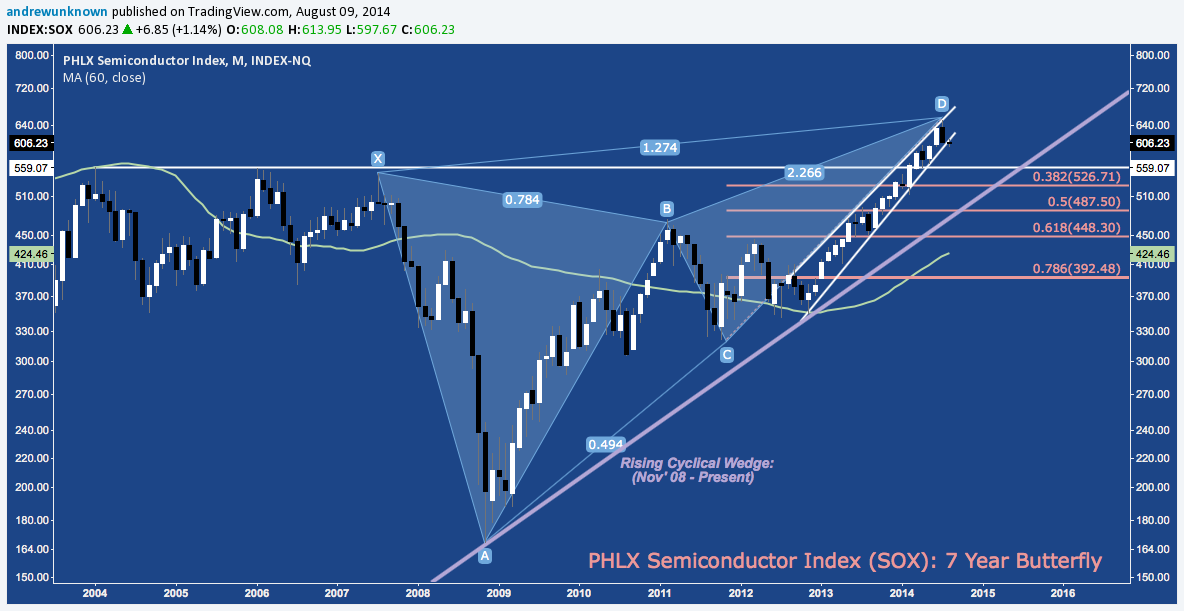
Semiconductors (SOX) are tentatively breaking down from 7-year Bearish Butterfly resistance at D…
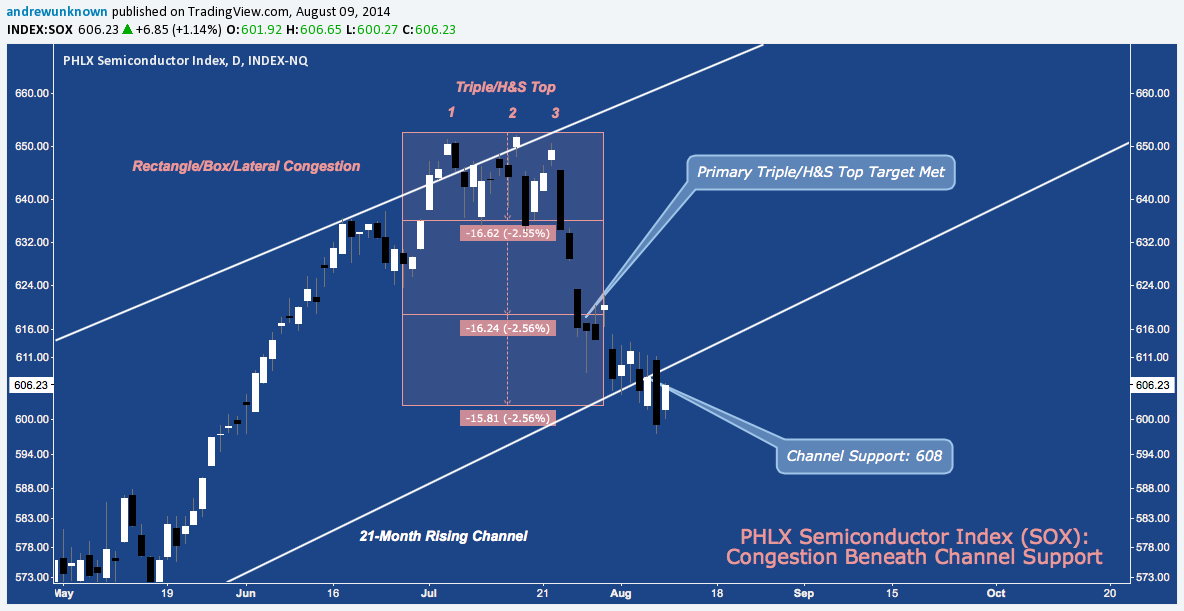
…breaching 21-month rising channel trend line support last Tuesday, returning to it Wednesday, losing it Thursday with a huge Bearish Engulfing candleand closing the week out just below it with Friday’s Bullish Harami:
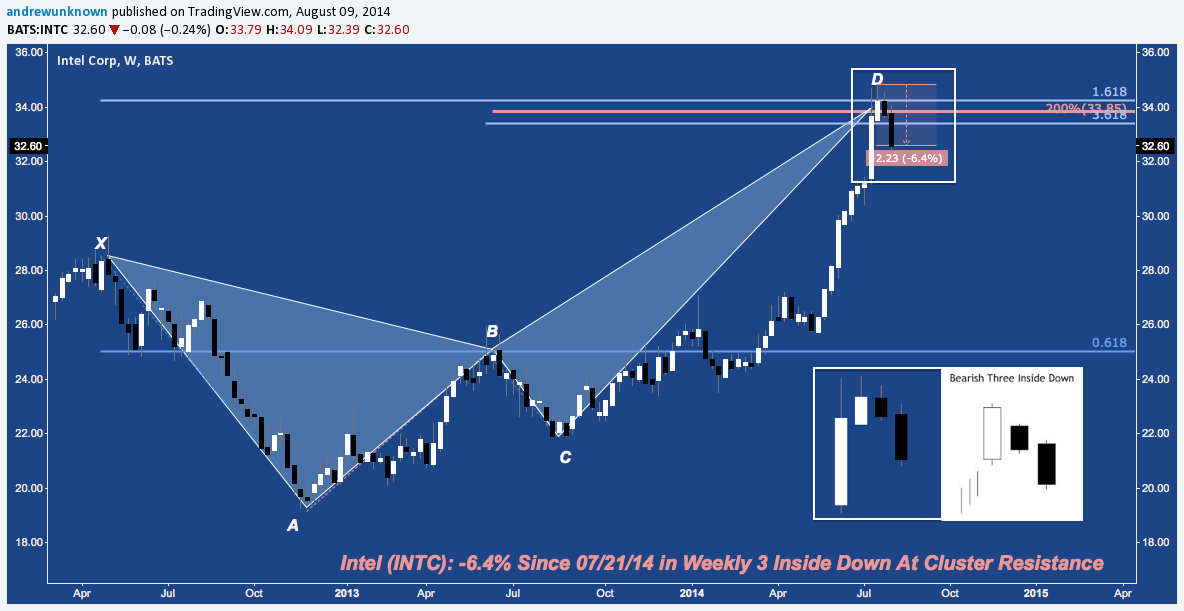
Intel (INTC), the largest Semiconductor stock by market cap weighted heavily the performance of the SOX with it’s second down-week in a row (after a record-setting 10-consecutive positive weeks), falling 6.4% since 07/21/14 and creating powerful Three Inside Down bearish reversal pattern at cluster resistance (D):
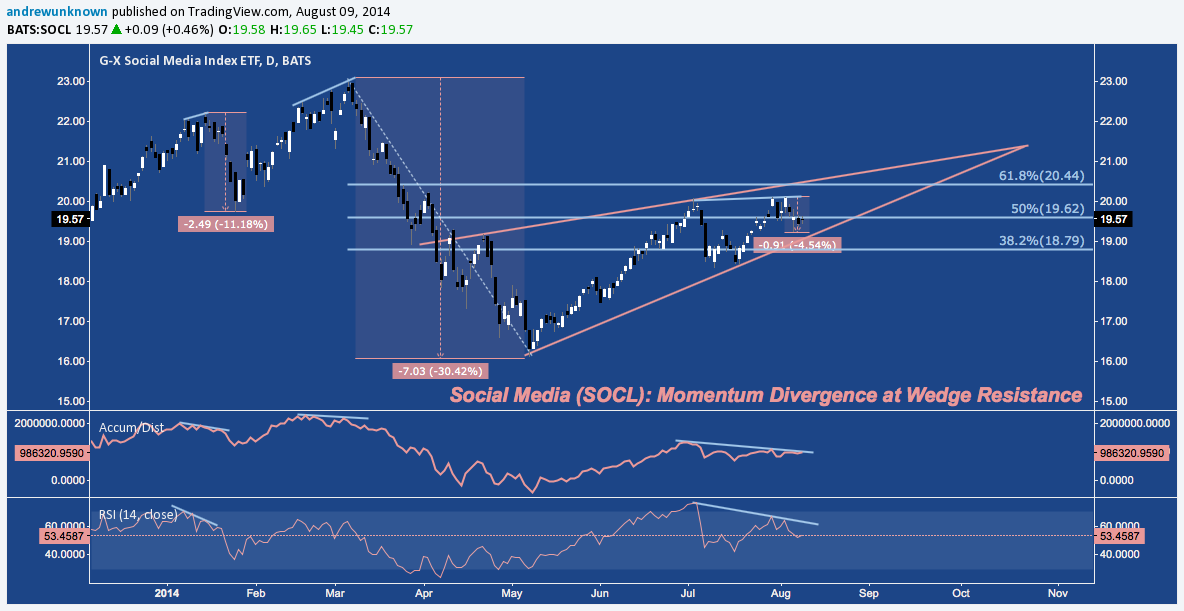
Social Media (SOCL) is under stealth distribution with a nominal higher high at Rising Wedge resistance last week on a sliding cumulative A/D and weakening momentum:
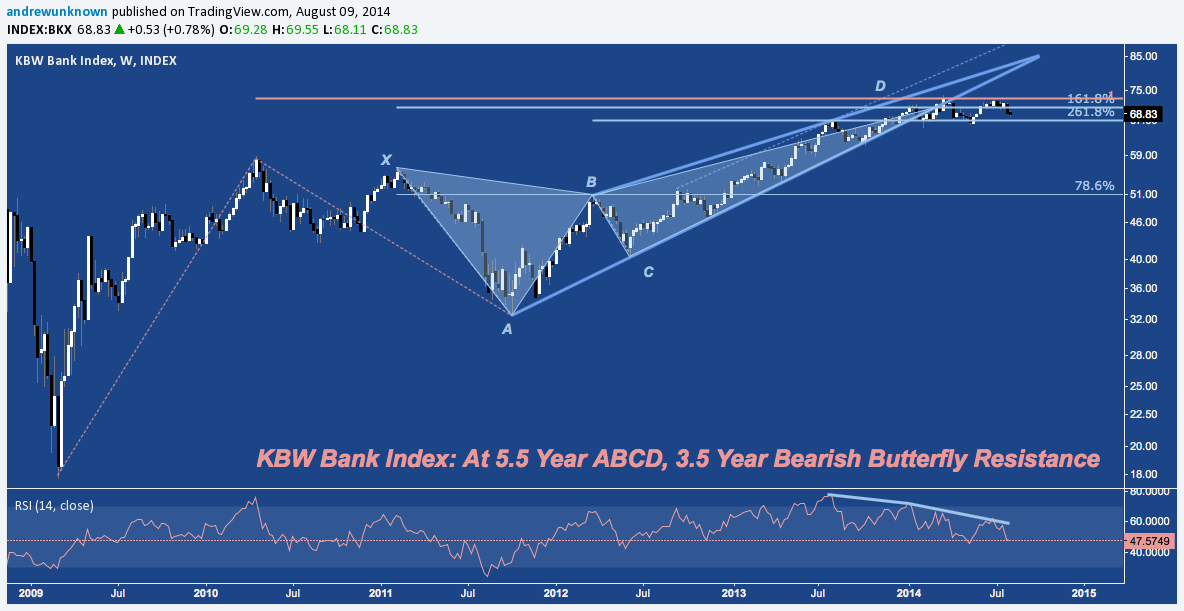
Money Center Banks (BKX) continue to stagger sideways at Bearish Butterfly resistance on flagging momentum:
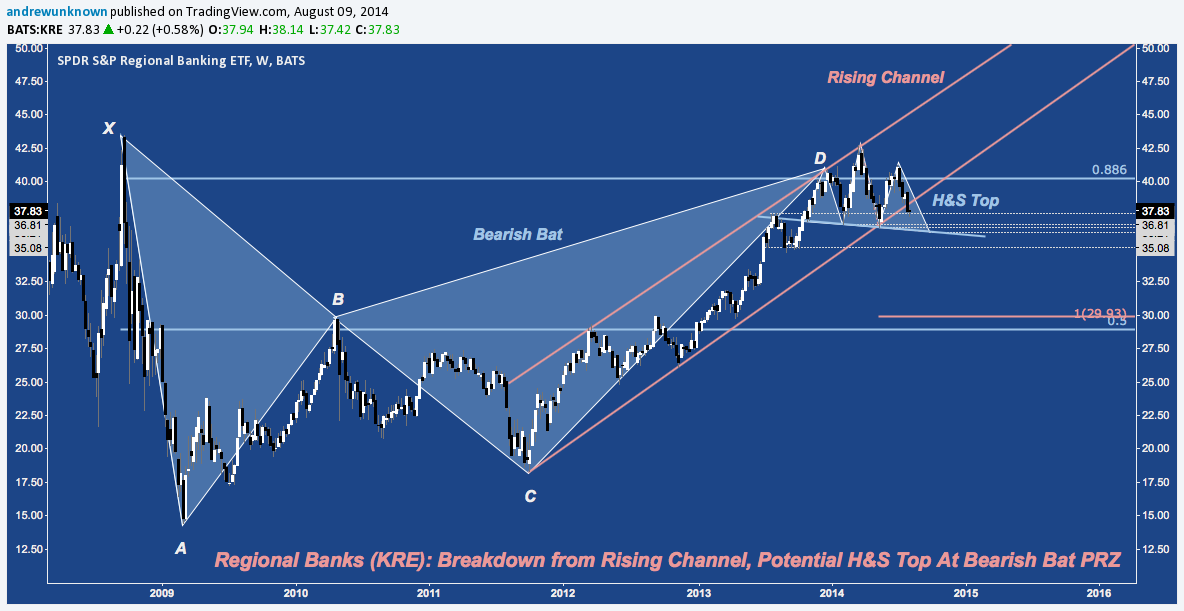
Meanwhile, Regional Banks (KRE) teeter at 6-year Bearish Bat resistance near $40 with a Head & Shoulders Top that sets up a measured move to $30, near B:
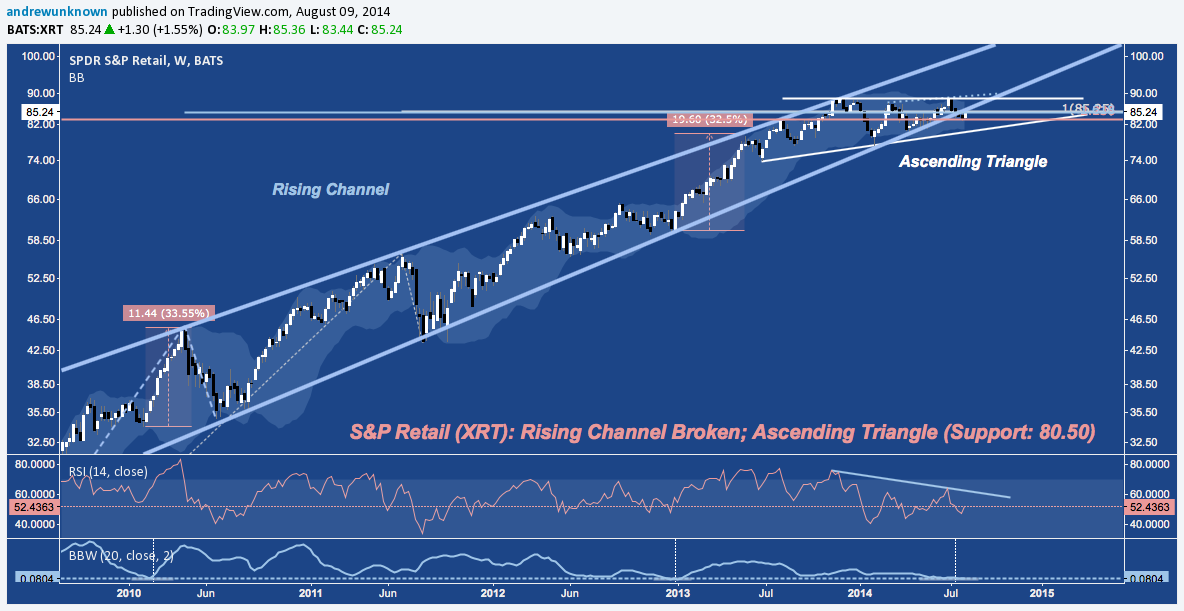
Retail (XRT) had a good week, relatively speaking, but remains below 2009-2014 primary rising channel support. It’s Ascending Triangle with volatility at 18-month lows and a sliding RSI suggests a significant volatility breakout is just ahead:
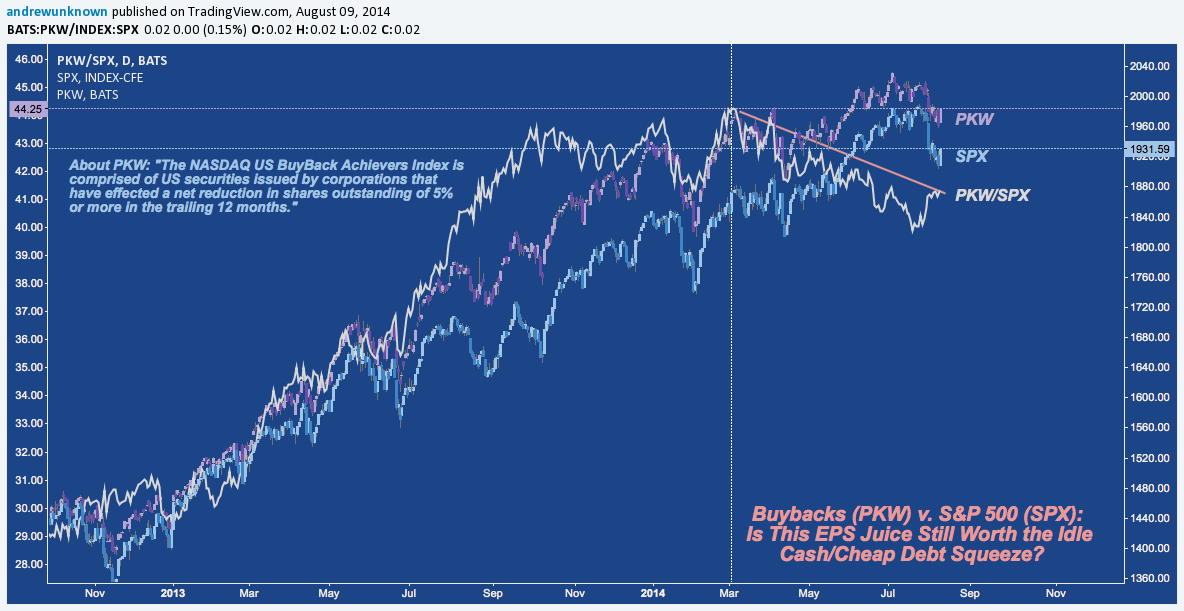
Buybacks (PKW) have bounced relative to the S&P in the last few weeks, but their under-performance since March following a reversal in yields supports the premise buybacks have peaked in the current cycle:
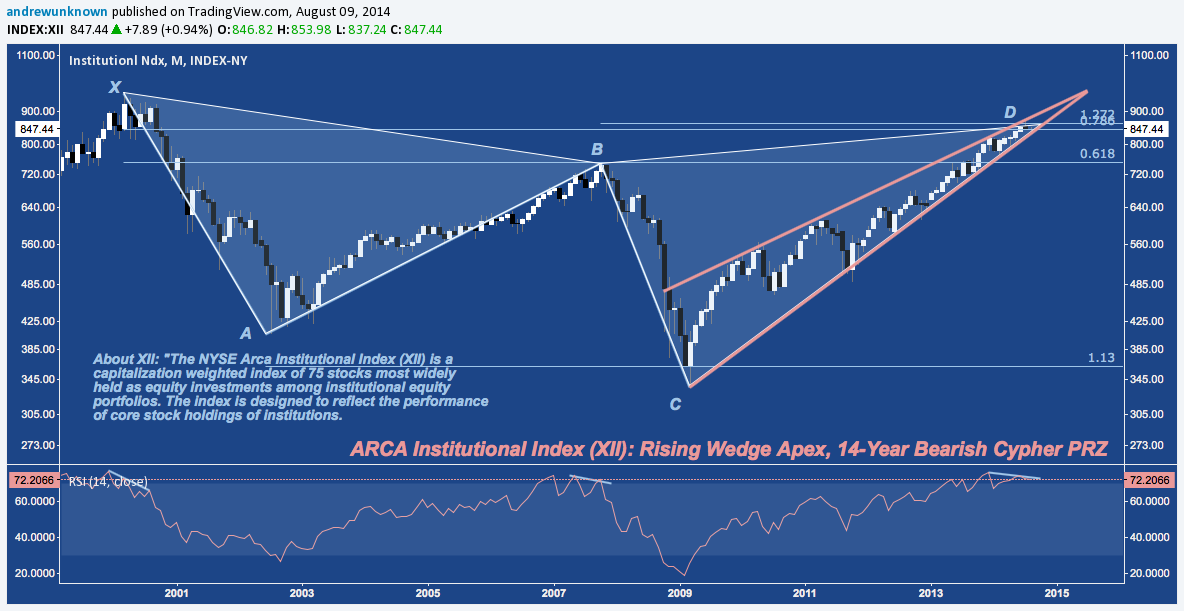
Institutional Equity Portfolios are at major harmonic resistance as they near their own 5.5-year Rising Wedge apex at historically overbought levels:
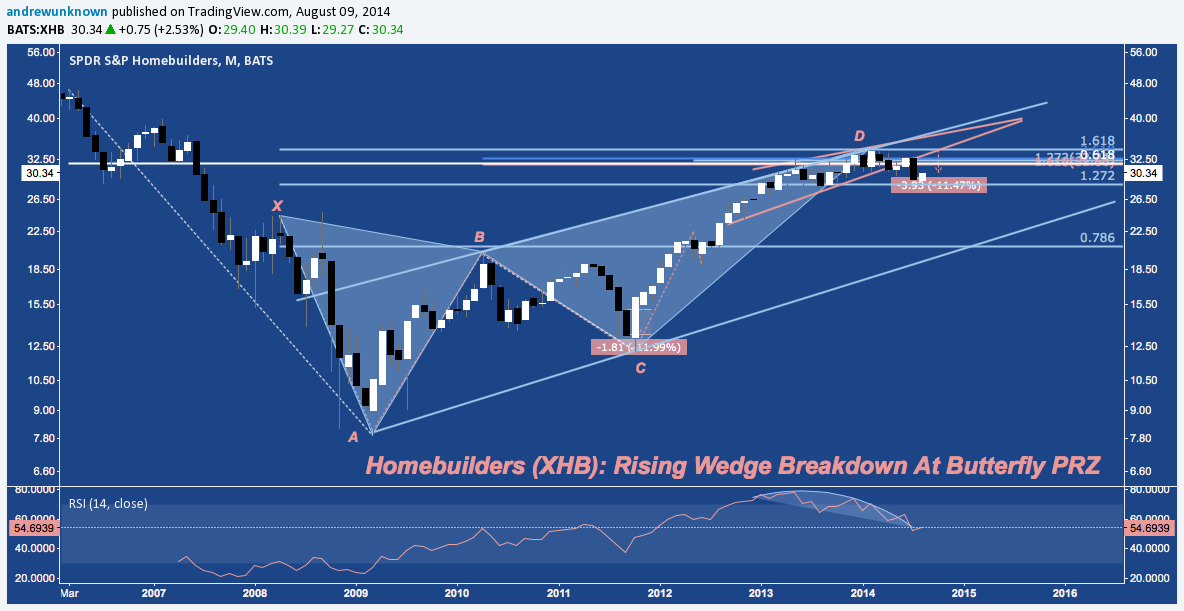
Homebuilders (XHB) bounced hard Friday (+2.53%, more than doubling SPX), rebounding after faltering as much as -11.5% since late June. XHB’s Butterfly suggests this oversold bounce has further to go on the downside before a sustained bottom is put in place:
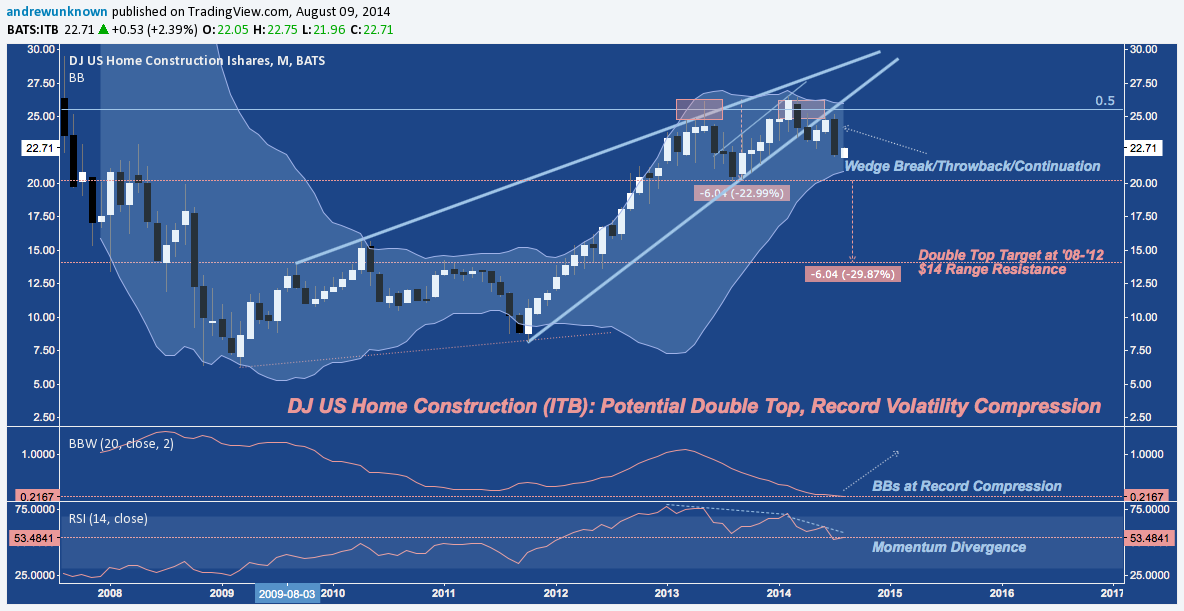
Similarly on the Ishares Home Construction ETF (ITB) which bounced 2.4% but continues to a threaten a Double Top at $20 with slowing momentum and volatility at historically low levels:
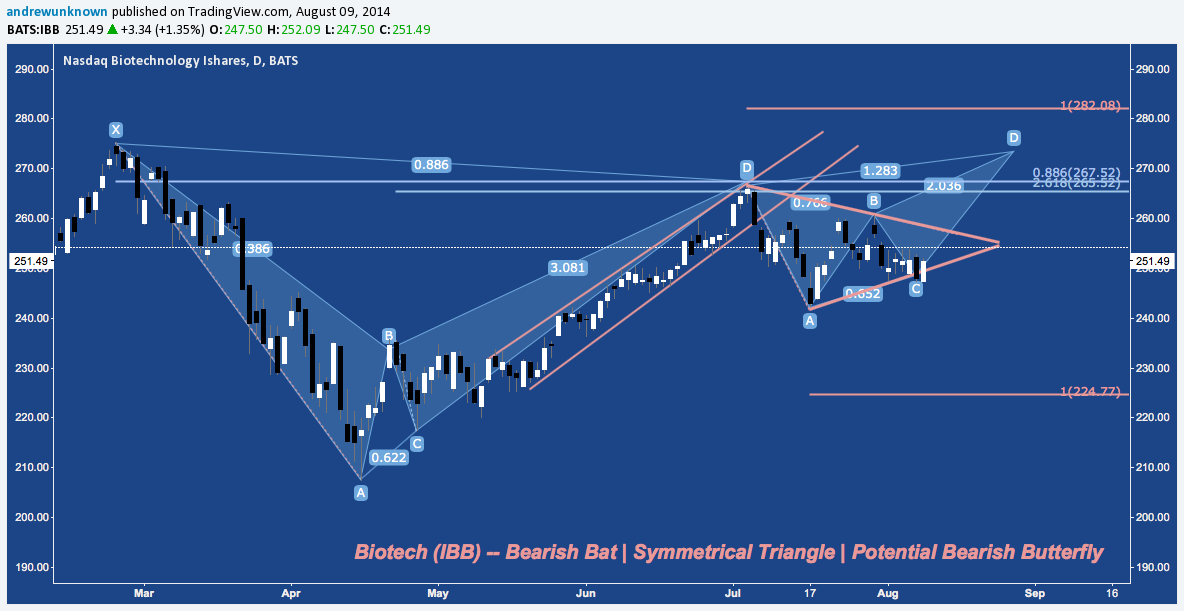
Biotech (IBB) finished last week at Symmetrical Triangle support as it’s slow motion breakdown from February-July Bearish Bat resistance continues. IBB’s lower high in early July continues to pose an nagging non-confirmation to XLV‘s higher high, with which it has a 1.0 long-term positive correlation:
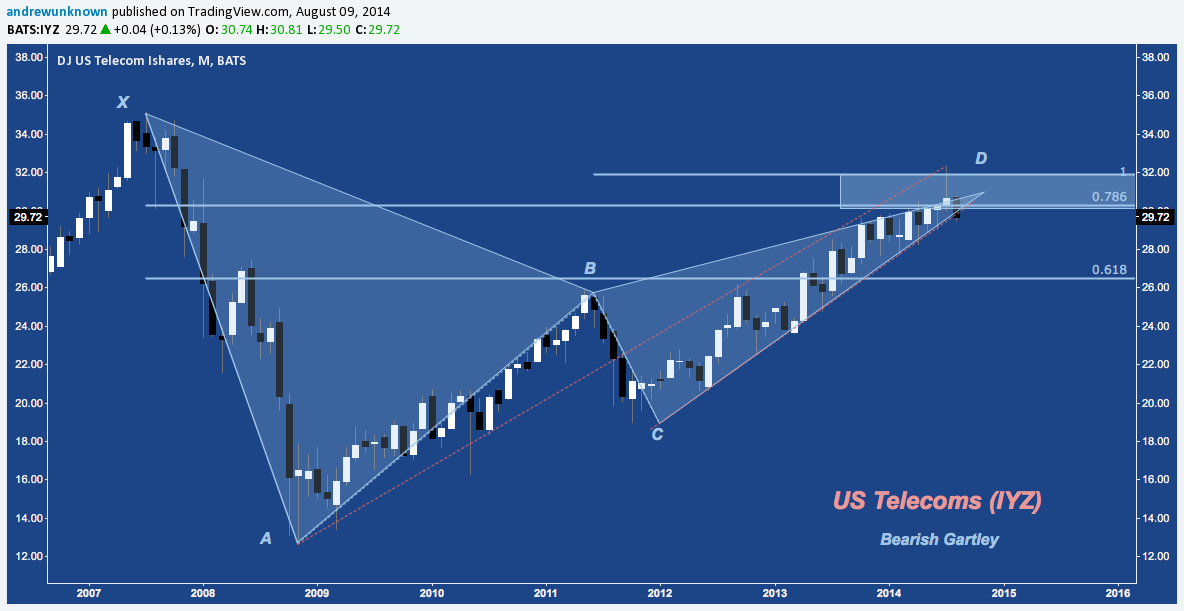
Telecom (IYZ) was one of the worst performing industries in August’s first week, continuing the sell off it ended July with from Bearish Gartley resistance near $32:
High Yield Corporate Debt (HYG) is faring a little better, though not by much after breaking down hard from both 1-year and 5.5-year Rising Wedge support in late July at each pattern’s respective 78.6% fibonacci retracement level.
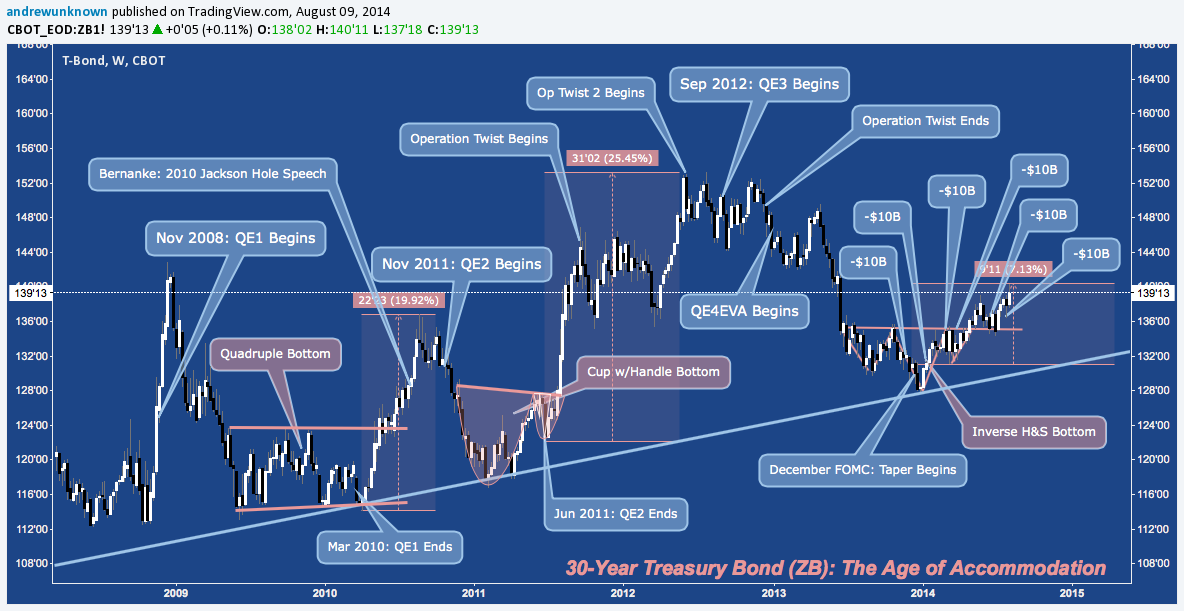
The Long Bond (ZB) finished off it’s highs above 140 but not before trading at levels not see since last Summer. ZB continues to conform to the pattern of rallies created with the cessation of asset purchases begun with the Quadruple Bottom at trend line support that followed the end of QE1 (+19% by September 2010), and continued with the Bullish Cup w/Handle pattern that spurred a 25% rally following the end of QE2. The current rally is more modest, seemingly following the Taper’s slower, staggered reduction of accommodation:
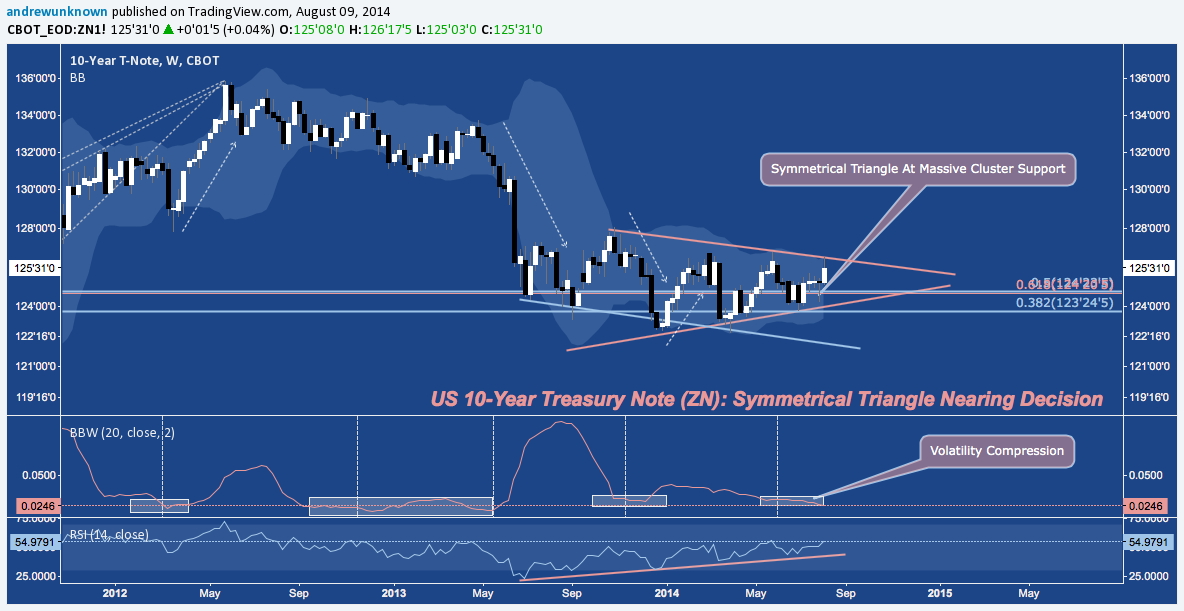
The 10-Year Treasury Note (ZN) is mostly unchanged since Fed Chair Bernanke began to allude to the Taper last Summer. Since the Taper was formally announced at the FOMC’s December 2013 meeting, ZN has funneled through a uniform Symmetrical Triangle just above cluster support near 124. The volatility compression and constructive RSI suggest an upside resolution to the triangle is possible, despite the looming end of QE (all other things being equal) at the end of October:
What looks exactly like the 10-year Note? Gold (GC):
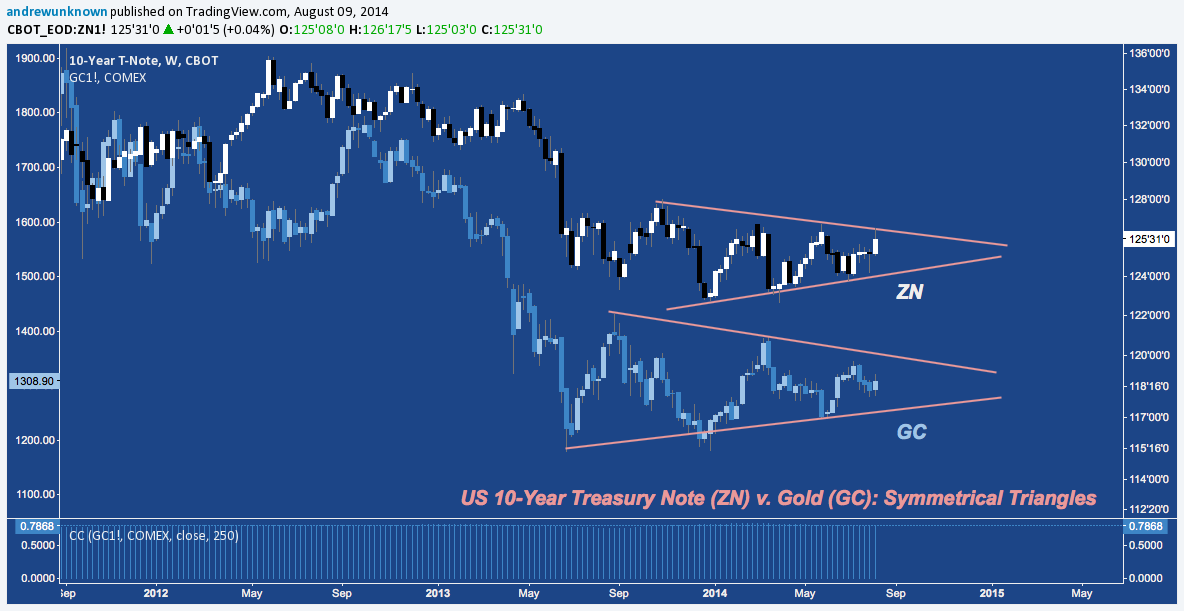
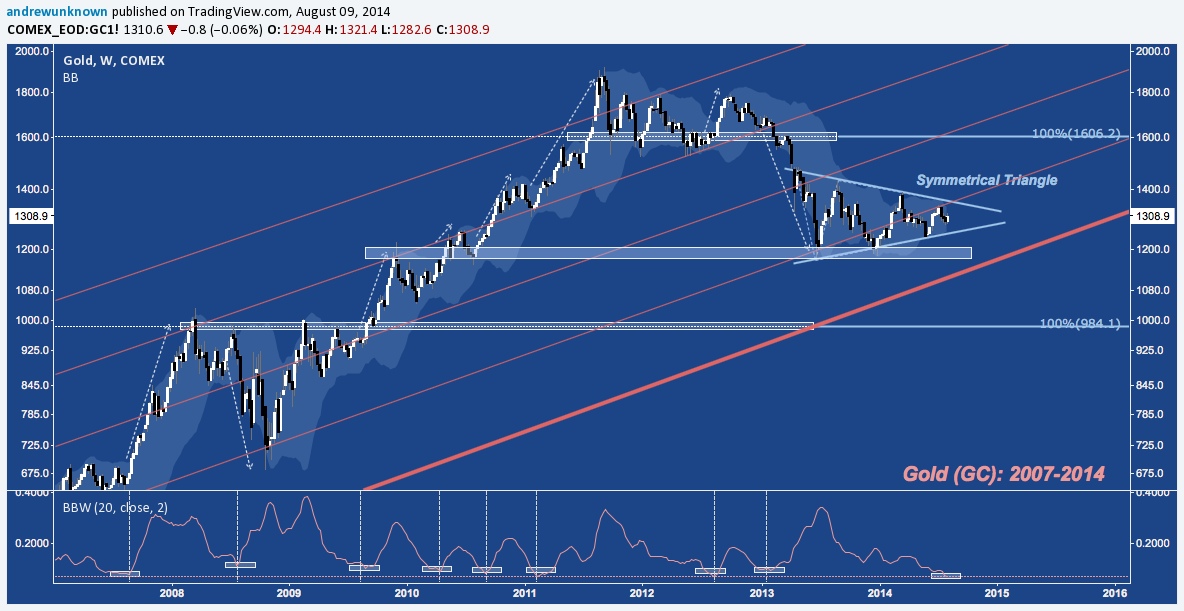
Gold (GC)‘s own Symmetrical Triangle continues to build out toward a major break, setting up with volatility compressed to levels that have set the stage for major direction moves in the past few years:
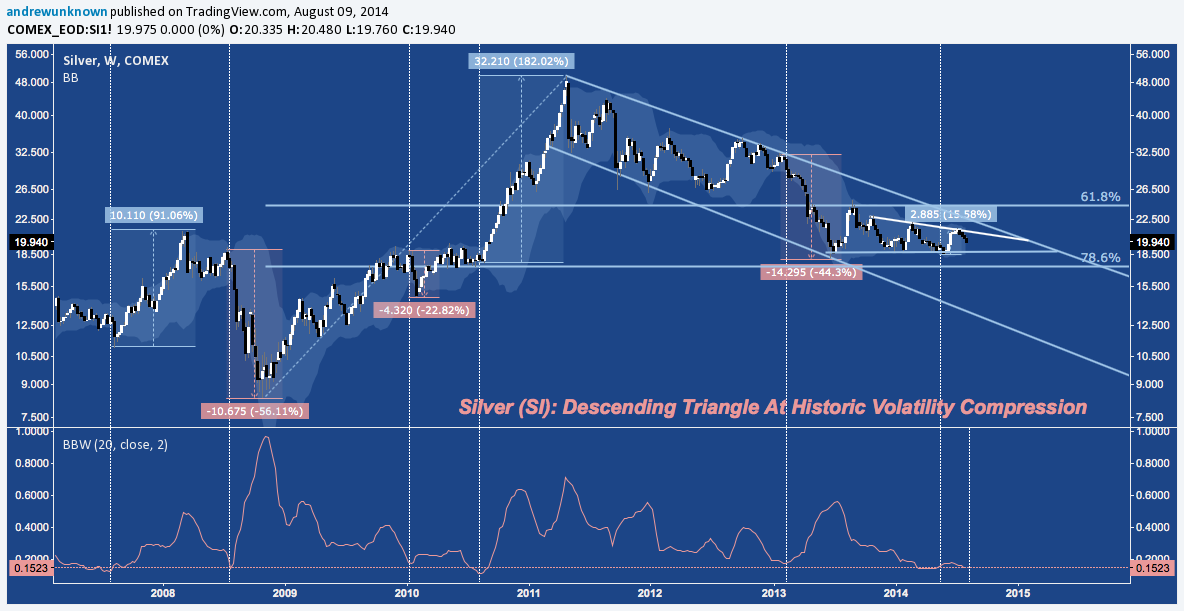
Silver (SI) is setting up for a very similar volatility breakout: in it’s case from a year-long Descending Triangle just above the key 78.6% fibonacci retracement of its:the 2008-2011 range:
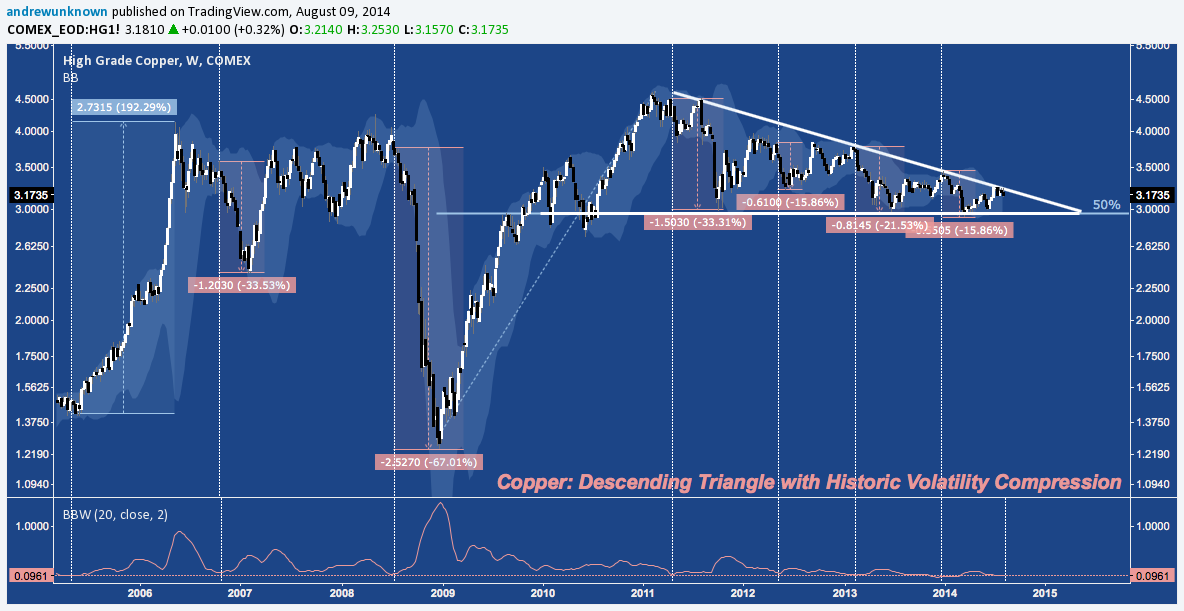
Copper (HG) is at it’s own Descending Triangle trend line resistance, ratcheting down tighter and tighter against multi-year support near 3. The volatility compression found across the metals complex is here as well, and has historically created major double-digit moves:
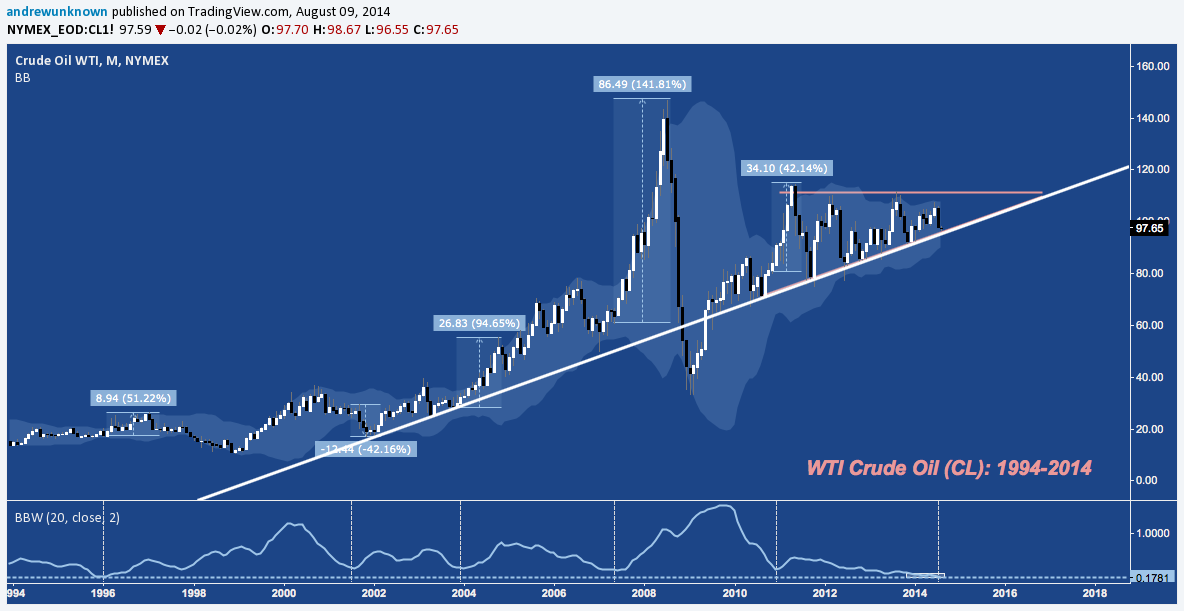
WTI Crude Oil (CL) is back to it’s Primary Rising Trend Line after proving incapable of rallying to Ascending Triangle resistance near 112 (orange). Since firm confirming it as support in 2oo3, CL has broken it’s primary rising trend line only once (in 2008 when the world was ending). With volatility at 18-year lows (see 1996), is it about to happen again; or will the Ascending Triangle resolve higher?
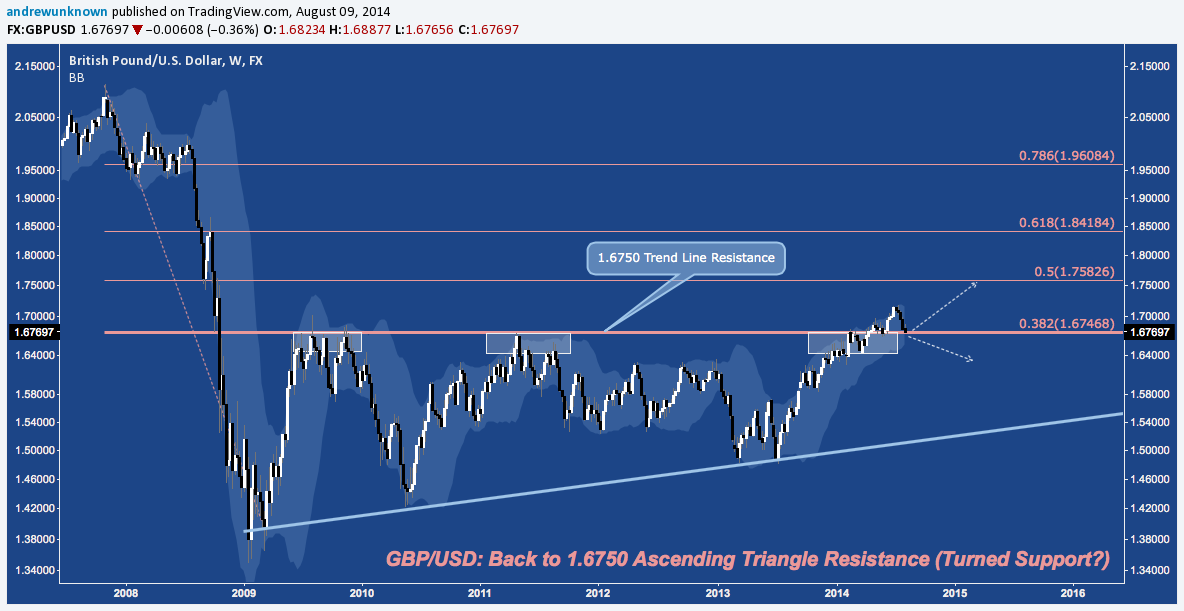
Speaking of Triangles, the Pound Sterling/US Dollar (GBP/USD) is back to it’s 5.5-year Ascending Triangle breakout level at 1.6750 after pushing above 1.70 for the first time since late 2008. Return move before pivoting higher; or is a massive failed breakout setting up that will set the stage for further USD gains?
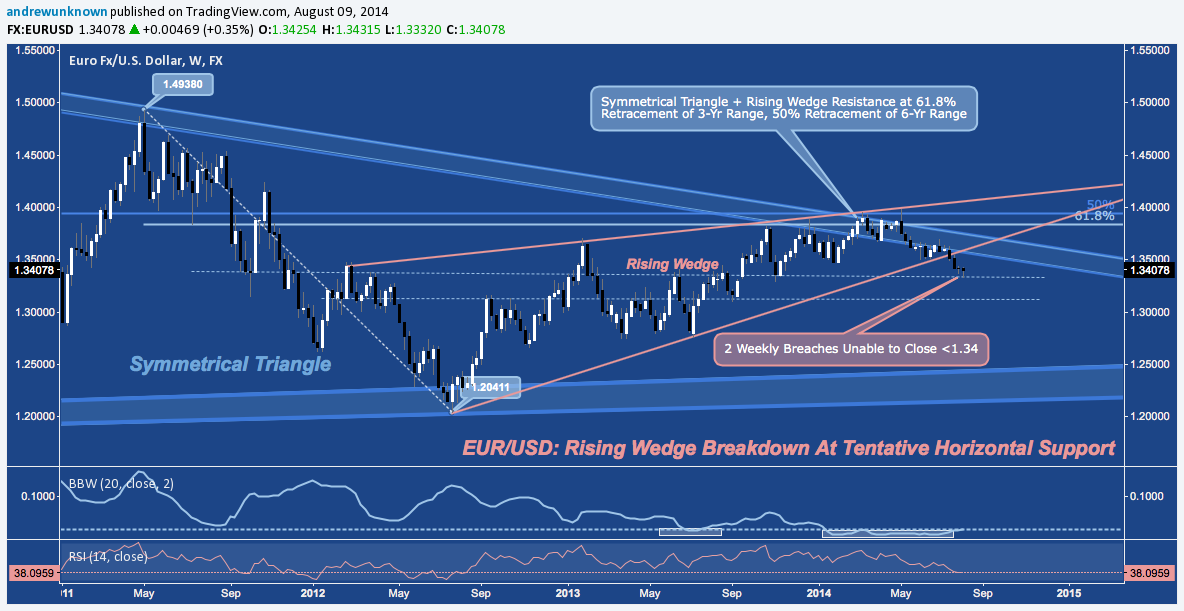
The Euro is also sliding against the Greenback, though the Euro/US Dollar (EUR/USD) monetary policy backdrop is much more lopsided than GBP/USD. Nonetheless, EUR/USD rallied late last week after the ECB held rates on Thursday, resulting in the second consecutive week that breached but rallied to close above 1.34. EUR/USD’s medium-term context puts the single currency on a defensive footing against the US Dollar after the pair’s 2-year Rising Wedge (orange) broke down following a sustained attempt to breach resistance near 1.40 earlier in 2014 failed.
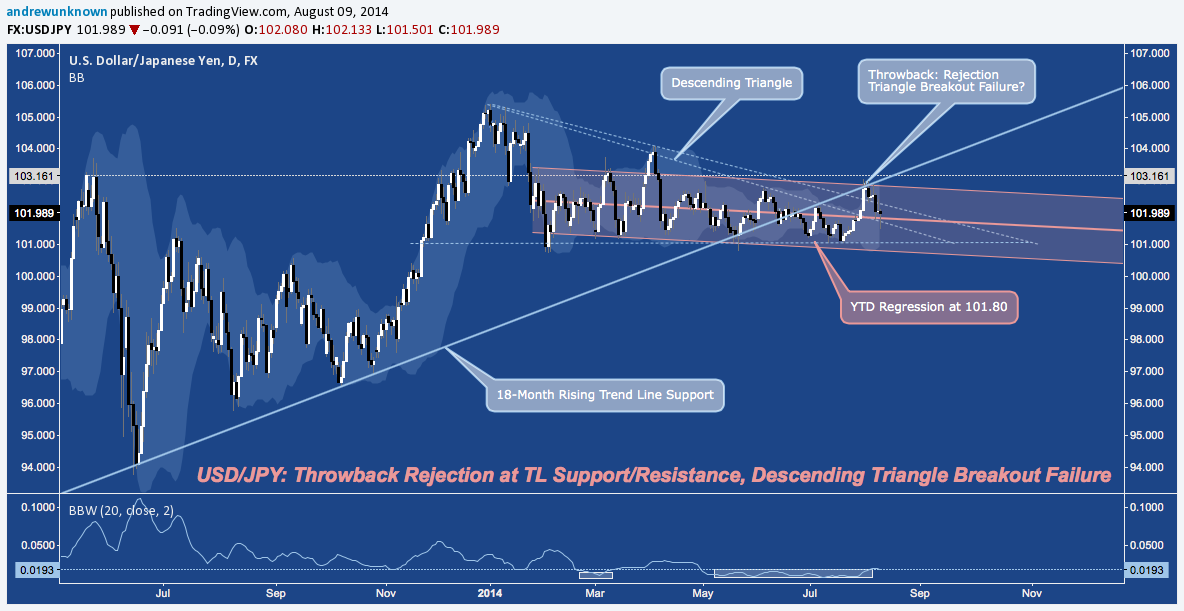
USD/JPY received a lot of attention some quarters for how it often rallies and fades in lockstep with US equities; and mostly for good reason. Despite it’s session-to-session function as a short-term funding currency, the US Dollar/Japanese Yen (USD/JPY) has been a remarkably stagnant pair throughout 2014 with it’s increasingly rare and minimal deviations from it’s YTD regression line near 101.80. Mostly as a function of this stagnation, USD/JPY has wandered sideways from it’s 18-month (Abenomics-era) rising trend line support, breaking down to 101 at the end of July before throwing back to retest and fail at the TL last week. USD/JPY is going through a record period of low volatility, suggesting the days of it’s aimless, rangebound behavior are numbered.
Twitter: @andrewunknown
Author holds net short exposure to Russell 2000 at the time of publication. Commentary provided is for educational purposes only and in no way constitutes trading or investment advice.


