 By Andrew Nyquist
I spend a fair amount of time talking about living within your means on a personal finance front. And really, that same respect for money and discipline comes into play on an investing front. You see, trading with discipline is key… even better with technical discipline (wink!).
When short-term market direction becomes a bit murky like it is right now, investors need to step back, clear their head, and ensure that they are not forcing things.
For instance, if you are a short-term trader trying to game the markets, it’s probably best to keep trading plans tight and concise. Realize that there is no need to force the action; it’s okay to keep positions smaller than normal and to keep your powder (cash) dry for good setups. And for those who are less active, it’s important to create and follow a plan based on longer term support and resistance levels. This will ensure that you are staying involved, yet comfortable.
And considering the current market environment and construct, discipline is a virtue. Price action has neutralized bullish sentiment, but this is exactly the time that the bull-bear squawking gets going; maybe it’s in the spirit of the presidential debate season! It’s best to stay out of the emotional thought process and focus on your plan. As Todd Harrison says, “discipline over conviction.”
Recent price action has offered little in the way of conviction. Sideways chop isn’t necessarily a bad thing, but it does throw some investors off, particularly when it comes time for price to exit the range; shake and bake or a classic fakeout is common, so be aware.
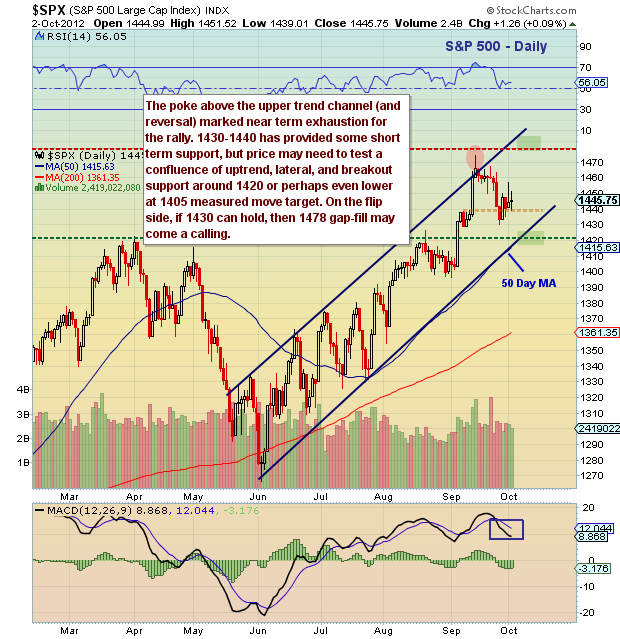
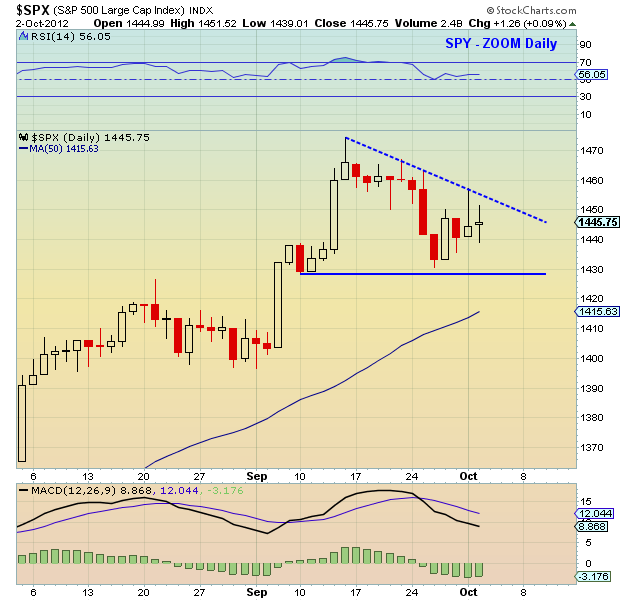
Technically speaking, the market went too far, too fast. After puncturing the upper channel line and driving for the 1478 open gap (still open), the market ran out of gas and reversed. But, so far, that reversal lead to a standard 3 percent pullback. But where it gets tricky, is that the trend didn’t immediately resume, like a typical “buy the dip.” Instead, we’ve seen a sideways chop. 1430-1455 is the range, and outside that range are 1478 and 1497 on the upside and 1420 and 1405 on the downside. See charts below. Good luck and trade safe.
———————————————————
Twitter: @andrewnyquist and @seeitmarket Facebook: See It Market
No position in any of the securities mentioned at the time of publication.
Any opinions expressed herein are solely those of the author, and do not in any way represent the views or opinions of his employer or any other person or entity.


