 Yes, the market is oversold and due for a bounce. But at the same time, the market is having trouble holding a bid. And the Volatility Index (VIX) is creeping higher.
Let’s recap: On Tuesday the S&P 500 saw a big reversal higher. But much of those gains were given back on Wednesday. And today we opened higher, only to see stocks sell off throughout the day.
Couple this weakness with the fact that the market has been in a long sideways consolidation and you have the potential for a roll over. But the market is fighting the urge to roll over. It’s just 4 percent off its highs and doing its best to fend off deteriorating market breadth. That doesn’t sound like a set up for a robust lasting rally… at least, not yet.
What we need now more than anything is some capitulation. Some say that we’ve seen it, but as an investor you also tend to feel it.
Earlier today, I shared a chart highlighting the last 3 years of market corrections with corresponding VIX and Equity Put-Call readings. As you can see (squint), we have seen fear rise… but is it enough? Keep in mind that the chart was through Wednesday’s close.
S&P 500 Market Pullbacks vs VIX Volatility Index vs Equity Put-Call Ratio
A look at recent S&P 500 pullbacks/corrections related to the VIX and Put-Call Ratio $SPY $VIX pic.twitter.com/HNihVL5Fea
— Andy Nyquist (@andrewnyquist) July 9, 2015
The VIX has quietly found its way back up to the 20 level. This likely indicates that fear of a deeper pullback is starting to settle in. But the longer we go on without any assertive direction, the more likely we are just buying time in wait for capitulation. This could lead to a volatile, back and forth rangebound market that lasts throughout the summer… and possibly into Fall.
Technically Speaking
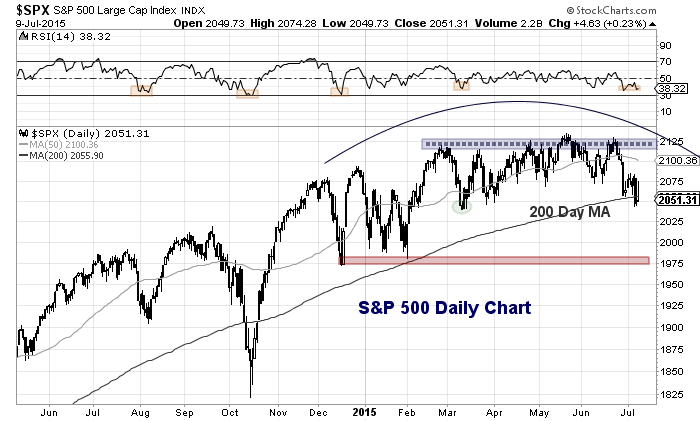
The S&P 500 is trying to hold in and around the 200 day moving average. This appears to be an important level near-term for investors. Note that today’s close was just below this level so it will be interesting to see if bulls can regain it.
There is near-term support at the March lows (2039). A break of this level would likely bring a test of 2014.75 (the .382 Fibonacci retracement of the October lows to May highs). The remaining near-term support level resides at the December/February lows (1972/1980).
S&P 500 Chart
It is turning into an interesting summer indeed. Lots of news, noise, and turbulence. I expect it to last into this fall.
Trade safe and thanks for reading.
Twitter: @andrewnyquist
Any opinions expressed herein are solely those of the author, and do not in any way represent the views or opinions of any other person or entity.


