The S&P 500 Index (INDEXSP:.INX) continued to trade in a very narrow range last week with the popular stock market averages virtually unchanged. The upside has been restricted by valuation concerns while the downside has been limited by record-low interest rates.
Although the longer-term prognosis for the stock market is for higher prices, the near term is becoming problematic.
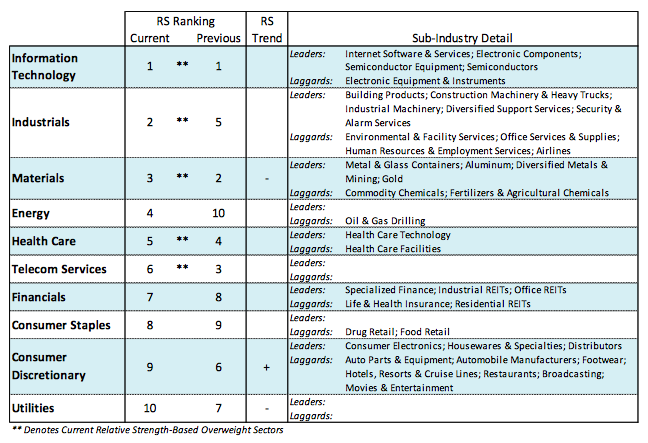
The U.S. economy is exhibiting modest improvement in the third quarter and raising concerns that the Federal Reserve will raise interest rates before year-end. Additionally, stocks are overbought and entering a seasonally weak period.
The history of the presidential election year cycle shows stocks typically struggle in the September/October time frame. Considering that most areas of the market are in gear, any weakness that does develop is anticipated to be limited to the 2125-2150 support zone for the S&P 500. Last week witnessed a continued rotation into growth areas of the market and away from defensive sectors, which we consider a positive development. Fed Chief Janet Yellen will address the annual central bank summit on Friday. Anticipation that Yellen could be more hawkish toward rates could keep stocks quiet leading up to the speech.
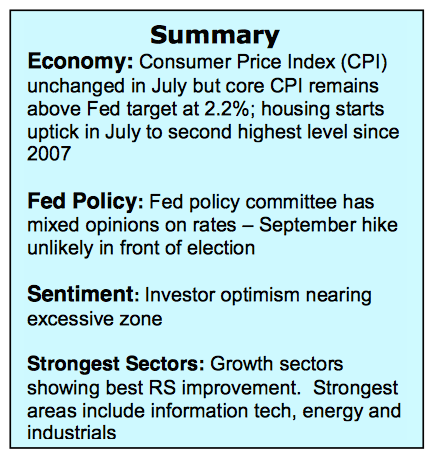
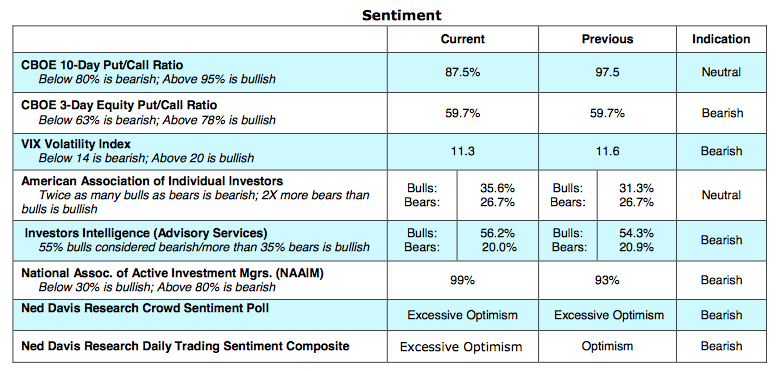
Investor Optimism Riding High – Will this be problematic for stocks?
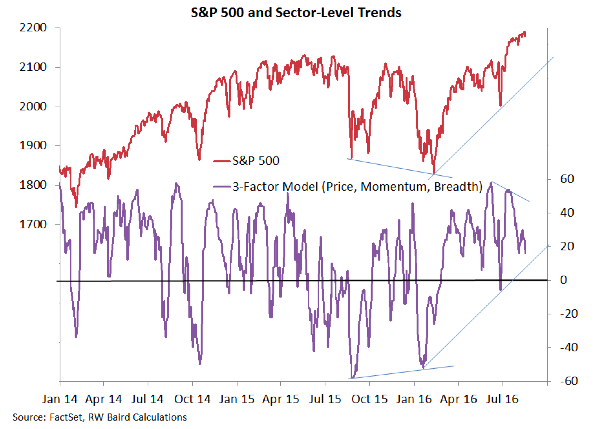
The technical condition of the equity market deteriorated last week. The strong upside momentum gathered since the UK vote to leave the EU appears exhausted. Stock market volume, an important ingredient for momentum, has evaporated in recent weeks which is not unusual in the weeks leading up to Labor Day.
Investor psychology, which had been cautious and skeptical, has shifted gears and is moving in the direction of excessive optimism. The latest report from Investors Intelligence, which tracks the opinion of Wall Street letter writers, shows a jump in bulls to 56%, the largest number of bulls since the first quarter of 2015. Historically, a move above 55% is a warning of an impending near-term peak in stock prices. At the lows for the popular averages in February, the bullish camp contracted to just 25%. The bears among the advisors fell for the fifth straight week to 20%. Additional signs of optimism are found in the most recent data from the National Association of Active Investment Managers that shows that group of investors allocation to stocks at 99%. The demand for put options declined last week and the VIX fell to an 11 handle which is a sign of investor complacency.
Thanks for reading.
Twitter: @WillieDelwiche
Any opinions expressed herein are solely those of the author, and do not in any way represent the views or opinions of any other person or entity.
 Rolling Over At Key Fibonacci Level?")


 Rolling Over At Key Fibonacci Level?")

