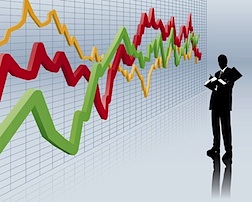
 The Dow Jones Industrial Average and the S&P 500 both closed at all-time highs on Friday, highlighting the prolonged strength of the current market trends. At the same time, the Russell 2000 Index, which is a proxy for US Growth stocks finally erased its losses for the year to close at +0.14%….for the year! But not all the news is ‘good’. The VIX is around 10. The VIX is the measure of options volatility and often is used as a gauge of risk. When the VIX goes down it signals complacency, whereas when it goes up it signals fear. A level of 10 on the VIX signals an extreme level of complacency. To help put that in perspective, the VIX hit a high around 80 in January of 2009. More recently, it has shown readings in 15-25 range. The point though is that the VIX rarely, if ever, falls below 10 (we closed last week at 10.73).
In other words, from a historical perspective, it’s unlikely to fall much further from where it currently is at. When the VIX goes up it often coincides with the stock market going down. The key word is often, so more on that later.
Confusion Reigns!
Guess when the last time the VIX was at 10? In early 2007. The US stock market indexes hit their high in Oct of 2007. And we all remember what happened after that.
But that doesn’t tell the whole story. Some other relevant data points include the fact that bonds continue to signal slow growth with the US 10-year Treasury yield at 2.6% (down 43 basis points from the beginning of year 3.03%). Remember, everyone on TV and in the newspapers were convinced that bond yields would go UP—they were wrong. Volume associated with Friday’s all time highs was 32% less than the average volume over the last 3 months. As I’ve written before, healthy markets have increased volume on up days and decreased volume on down days. We are currently seeing the opposite.
I utilize a variety of research sources and proprietary indicators to determine market trends and manage risk. The trending indicators are signaling that the US stock market is resuming its uptrend. Yet that contradicts Macro research, the VIX, bond yields, REITS and trading volume studies!
Market Trends (Trending Indicators):
US Stock Market Trending Up (Trend Change has occurred)
Canadian Stk Mkt Trending Up
US Bond Market Yields Trending Down
So what should investors do? Which one is right?
The truth is that there isn’t any way to know for sure. The VIX is a good indicator but it doesn’t mean that a downturn is imminent. Both the Macro and the trending indicators can be right. Risk happens fast, and when the markets start to correct they can do so very quickly. On the other hand, markets can remain irrational longer than we think.
Let’s review the numbers through last week:
US Stock Market Indexes YTD
DOW +2.1% All-time high
SP500 +5.1% All-time high
NASDAQ +3.5%
Russell 2000 +0.14%
Canadian Stock Market (EWC) YTD +6.21%
Bond Market YTD
20 year + UST (TLT) +9.41%
National AMT Muni (MUB) +4.35%
Vanguard REIT Index (VNQ) +17.94%
VIX (Volatility Index) Reading: 10
.73
Here’s what I know and what I’m doing:
The Canadian market continues to do well so I remain invested there and may be adding to those positions. On the other hand, several of my US stock-oriented strategies have been in cash since March while others have been invested. Based on the trending indicator signals, I expect to put some of that side-lined cash to work. I will likely adjust the position size of those investments as one way of managing risk. And I will continue to closely monitor all of this and take action as necessary should market trends change.
Any opinions expressed herein are solely those of the author, and do not in any way represent the views or opinions of any other person or entity.
 Ready To Break Out?")


")

