The S&P 500 is now down around 7 percent on the year, while the NYSE Composite Index is down around 9 percent year-to-date. Is the very long-term bull market still in play? Yes it is!
But that doesn’t mean that there aren’t market risks over the short-term. The chart below looks at the NYSE Composite on a monthly basis, dating back to 1965. click to enlarge
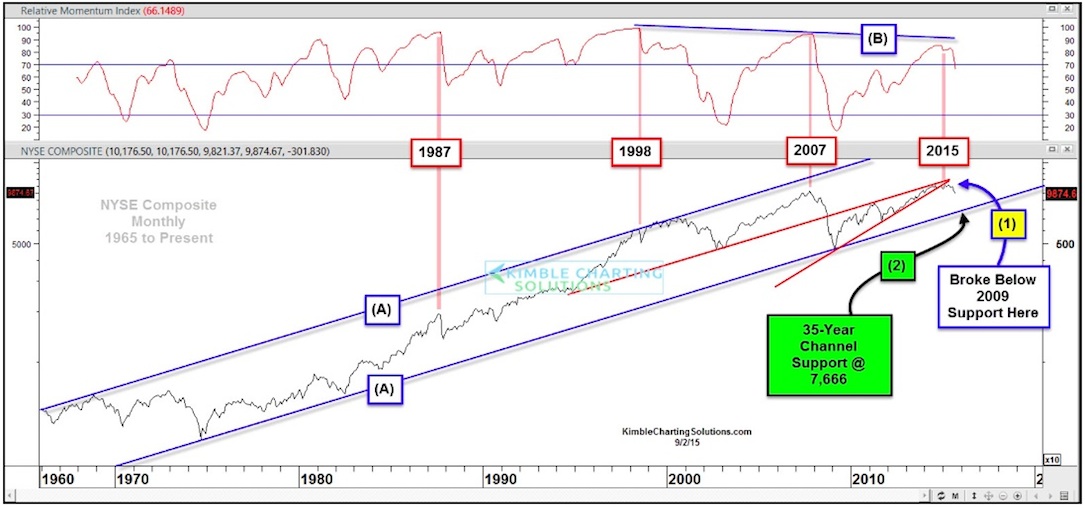
As you can see, since the mid 60’s, the NYSE Composite has remained inside of rising channel (point A). The last time the top of the channel was touched was in the late 1990’s tech craze and the last time the bottom of the channel was touched was at the lows of the financial crisis in 2009.
Despite the quick down turn of late, the long-term rising bull market channel remains in tact.
However, I think it’s important to review the chart in light of investor time frames and point out some things that caught my eye in the chart (both short and long term).
- The NYSE hit mid-range parallel resistance a few months ago and recently broke below rising support created from the 2009 lows – see point (1).
- Monthly momentum reached lofty levels recently (last seen in 1987, 1999, 2007 and now) and momentum has started to turn lower – see point (B). Note that monthly momentum has been creating a series of “lower highs” over the past 17-years.
- From a 30,000 foot view, the 40-year rising bull market trend remains in tact!
Now that the 2009 support has given way, which is something to respect, where does long-term support come into play?
- The last time the NYSE touched the bottom of this rising channel was back in 2009, as it stopped on a dime at support, during the financial crisis. That support line extended now comes into play at the 7,666 level, which is around 20% below current prices – see point (2). This doesn’t imply that’s where it’s headed, but it is one of the market risks to consider.
If you are a long-term bull and like to play long-term rising channels, you should feel good that the long-term trend is still up and 40-year support has not been broken.
However, the short-term warnings signs and market risks would have my attention if you are a more active investor/trader… that support is a long way away. The 6 year rising support has been violated and monthly momentum is still lofty, making a series of lower highs over the past several years. Some might view these lower highs as a divergence against the long-term trend and a potential short-term headwind. Again, these are just my observations.
Thanks for reading and good luck out there.
Twitter: @KimbleCharting
Author does not have a position in any mentioned securities at the time of publication. Any opinions expressed herein are solely those of the author, and do not in any way represent the views or opinions of any other person or entity.

 Rolling Over At Key Fibonacci Level?")


