What We Are Watching
This Week’s Market Outlook:
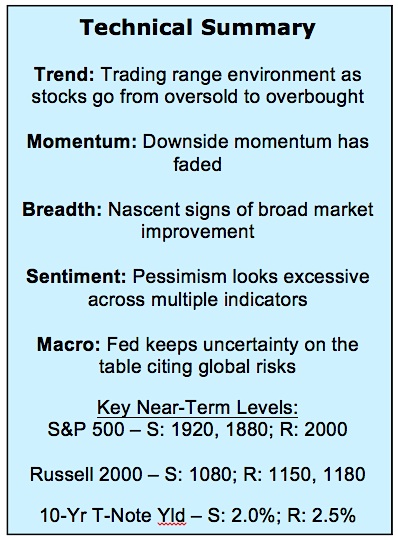
Downside Momentum Has Stalled – Last week we were looking for a 10-to-1 upside/downside volume day support the view that downside momentum had been broken. We got that this week, with a 15-to-1 day on Monday. Weekly MACD momentum on the S&P 500 also appears to be ticking higher.
Market Breadth Trends Improving – The disparity in sector level returns is narrowing and there is evidence that the stock market is getting back in gear. Sector-level trends are improving. While the strength seen so far is not sufficient to upgrade our overall view of the broad market, we are seeing progress in that regard and will continue to monitor market breadth.
Trading Range Intact – While the 120 point move on the S&P 500 over the past eight trading sessions has been impressive, it has basically just moved the stock market from oversold at support to over-bought at resistance. Further strength (and additional upside momentum) may be needed to argue that the S&P 500 has moved out of a trading range environment and that a sustainable rally has emerged.
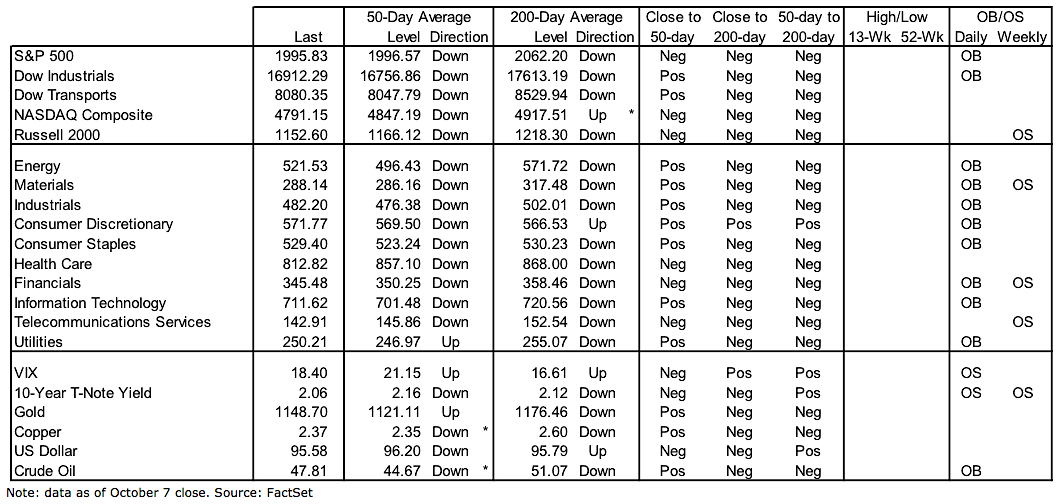
Stock Market Indicators – Indices & Sectors (click to enlarge)
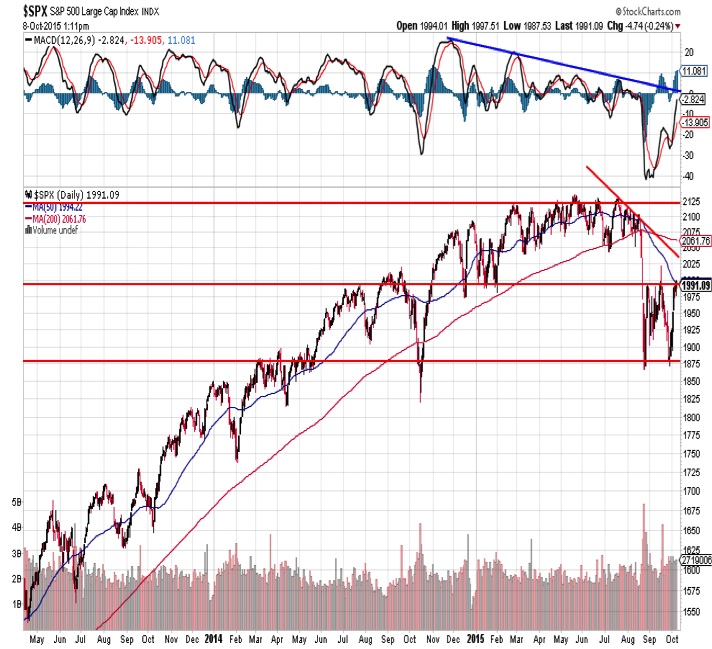
S&P 500 Index
The S&P 500 has moved from being oversold at support to being overbought at resistance. From a price perspective, the trading range that has been established over the past month and a half is very much intact. The momentum backdrop, however, is improving (see the higher low followed by a higher high on the MACD chart) and that could help clear the way for further strength into year-end if price resistance can be overcome.
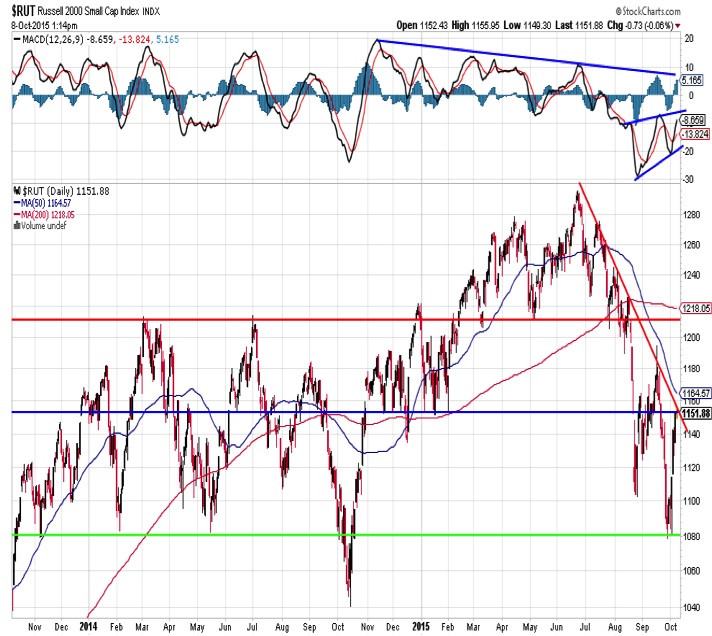
Russell 2000
The small-cap Russell 2000 is facing a similar setup, but with one key difference. While the S&P 500 is overbought within a well-defined trading range, the Russell 2000 is bumping up against down-trend resistance. A failure of the current rally to carry above 1180 would perpetuate the series of lower highs and lower lows.
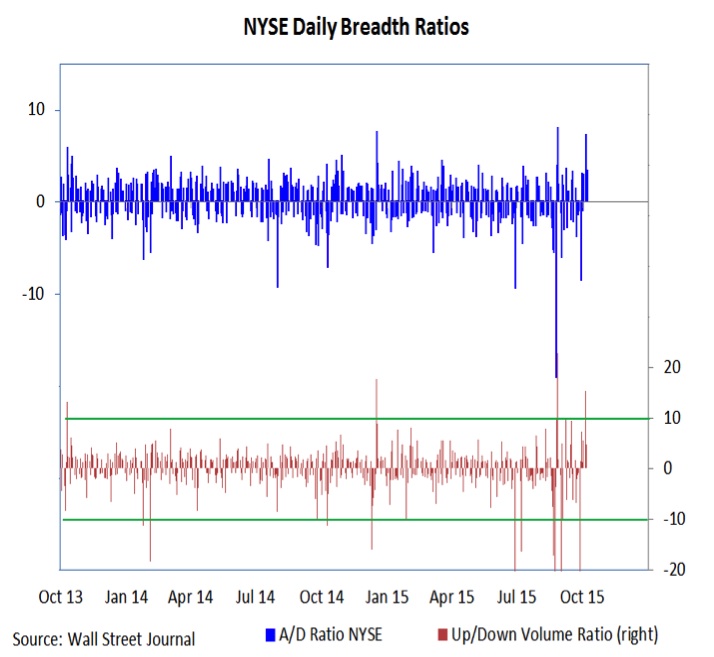
NYSE Market Breadth
The Rolling Stones were probably correct that you can’t always get what you want. But sometimes apparently you can. Last week we talked about looking for an upside/downside volume thrust to suggest that downside momentum was fading. The stock market supplied that this week, with upside volume on the NYSE outpacing downside volume by 15-to-1 on Monday. It is not enough to argue for broader upside momentum, but it does help quell the downside thrusts that had emerged and neutralize prior negative market breadth readings.
continue reading on the next page…


