 During a market correction I focus almost exclusively on finding and studying the price action of individual stocks that are demonstrating relative strength versus the general market. The primary technical indicators I use are the MarketSmith Relative Strength Line (RS Line) and MarketSmith Relative Price Strength Rating (RS Rating) which runs from 1 to 99 with 99 being the best RS Rating. I’m looking for stocks that show a RS Rating of at least 70 and the RS line is in new highs before price. The two indicators combined provide an objective evaluation of how the stock measures up against the rest of the equity market. The RS Rating is the science and the RS Line is the art.
For clarity the definitions of Relative Strength Line and Relative Price Strength Rating are below (sourced from Investors Business Daily):
The RS line shows how that individual stock is faring compared to the S&P 500, the proxy for the broad market.
And don’t confuse the RS line with the Relative Price Strength Rating; they are not the same. The RS Rating (1-99) compares a stock’s price performance against all stocks in IBD’s database over a trailing 12-month period.
The following matrix shows how I evaluate and rank stocks during a market correction. I’m assuming that the RS Rating is at least 70 and stocks meet my basic fundamental metrics.
Relative Strength Line / Price Matrix
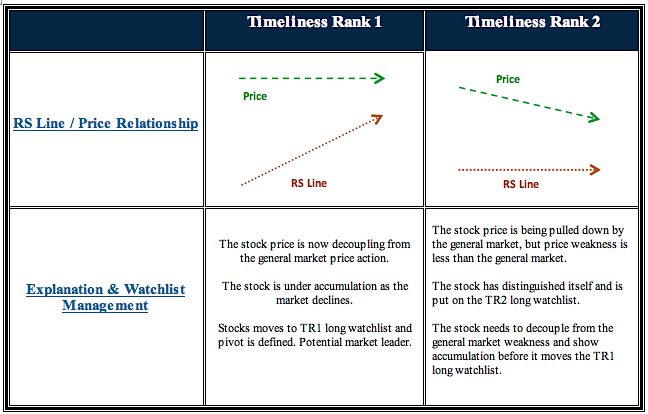
I have come to use ‘the number of stocks with the Relative Strength Line in new highs before price’ as an indicator. If the breakout attempts quickly fail it is a clear signal that the market is not ready. Inversely, if a few breakouts generate a follow-through it raises the odds the market is firming. The key is to not get excited and trade with full positions. Stick to pilot buys and don’t forget your stop-loss criteria.
In order to see the concept in action I have listed a few tweets from my twitter (@hertcapital) and StockTwits (also @hertcapital) accounts with accompanying comments and annotated charts. The “underlined” stock symbols were early market leaders off the June 2013 lows. You can go to either account to confirm the tweets.
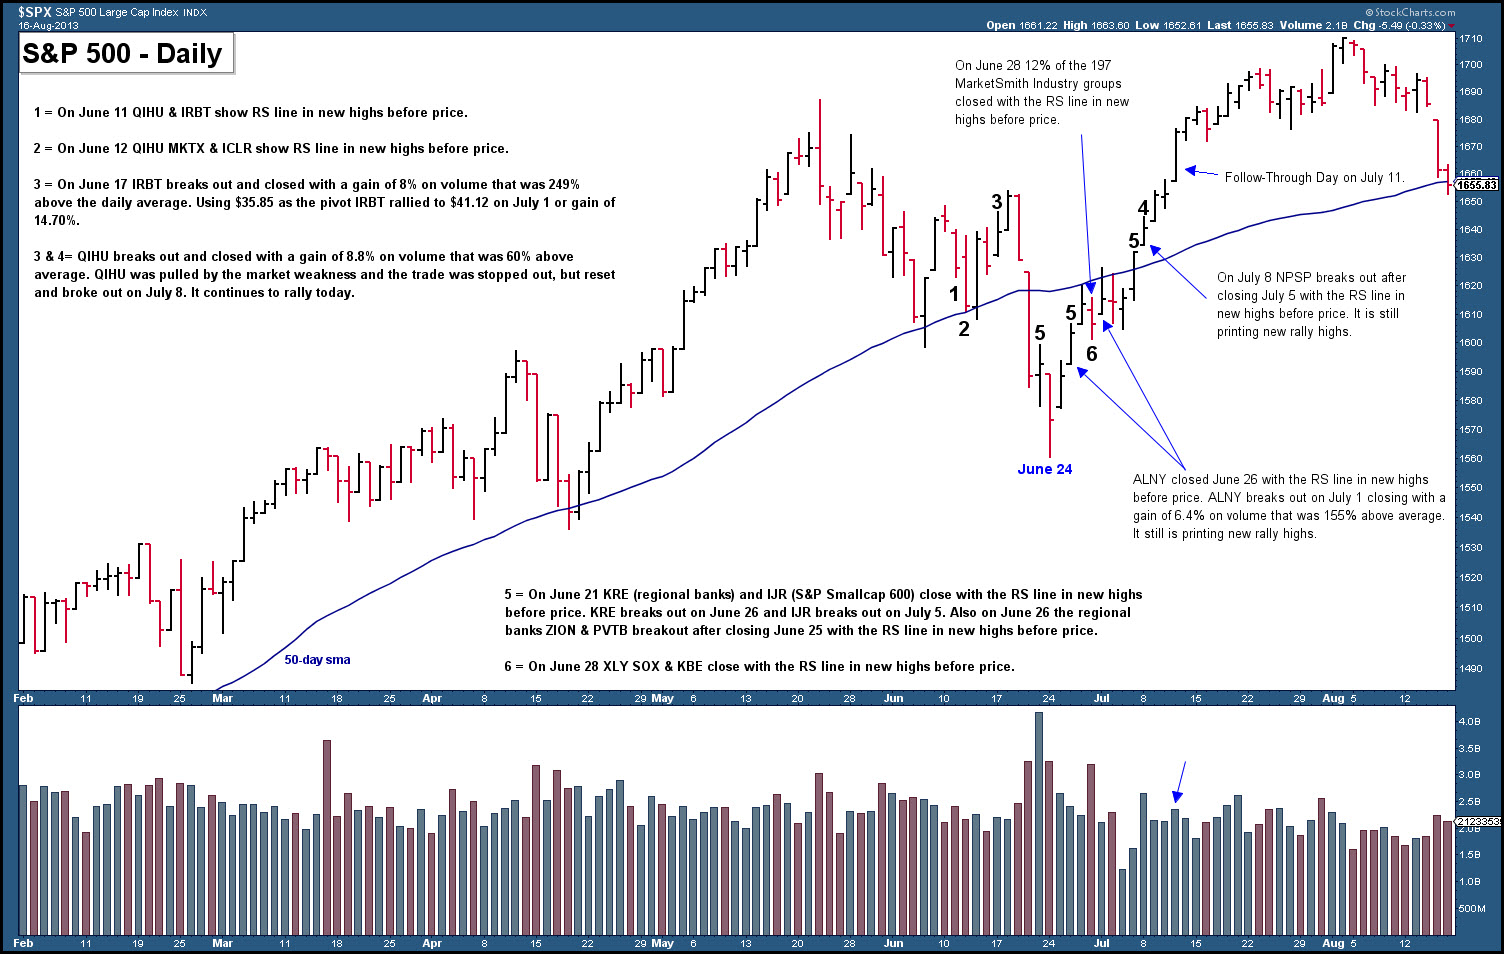
S&P 500 Daily (February 2013 – August 2013)
I use the S&P 500, because it is considered to be a broad representation of the equity market. Click images to enlarge.
hertcapital: Select stocks that closed with the RS line in new highs before price. $FSLR $QIHU $NVDQ $IRBT $HTZ $HOS $GLF $ODFL $AIZ $PXD $ACHC
11 Jun from StockTwits Web
hertcapital: Select stocks that closed with the RS line in new highs before price. $QIHU $VSAT $CPA $MKTX $PODD $WX $ICLR $WCN
12 Jun from StockTwits Web
hertcapital: Select stocks with the RS line in new highs before price. $QIHU $QIWI $CSII $NVDQ $CPA $NUS $MKTX $THRM $AIZ $PXD $ADS
13 Jun from StockTwits Web
Thirteen days before the S&P 500 low there are already a small group of stocks that are potentially ready to breakout. QIHU and NUS do breakout and have continued to rally.
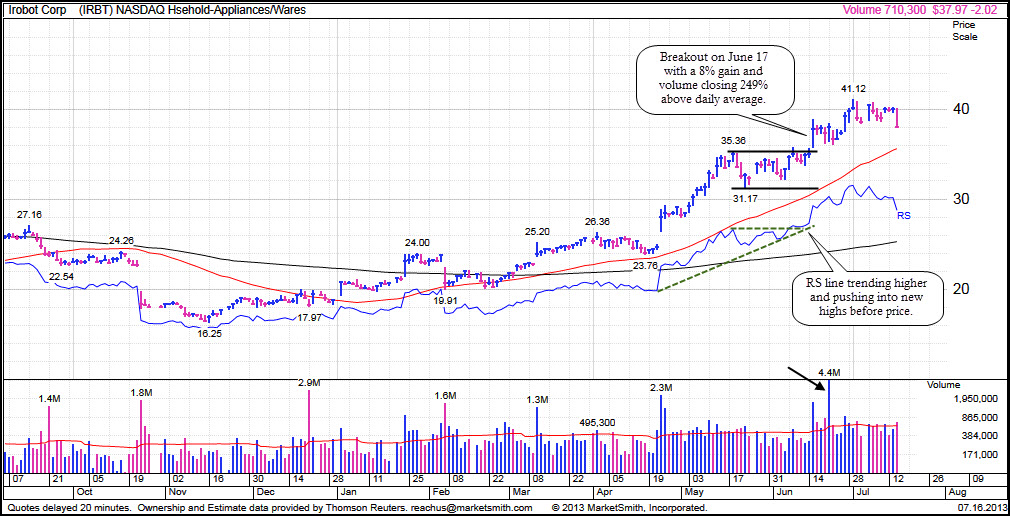
IRBT – Daily Chart
hertcapital: $KRE closed up for the week & RS closed in new highs on Friday.
24 Jun from StockTwits Web
hertcapital: $IJR S&P Smallcap 600 closed Friday with the RS line in new highs.
24 Jun from StockTwits Web
hertcapital: Select stocks that closed Mon. with the RS line in new highs before price. $ILMN $V $CLB $SEP $MNRO $NXST $MDSO $MEI $TRS $CHUY
25 Jun from StockTwits Web
hertcapital: Select stocks with the RS line in new highs before price. $NXST $MDSO $VSAT $ILMN $SSP $BLOX $DIOD $ZION $PVTB $V $UNP $CMA
26 Jun from StockTwits Web
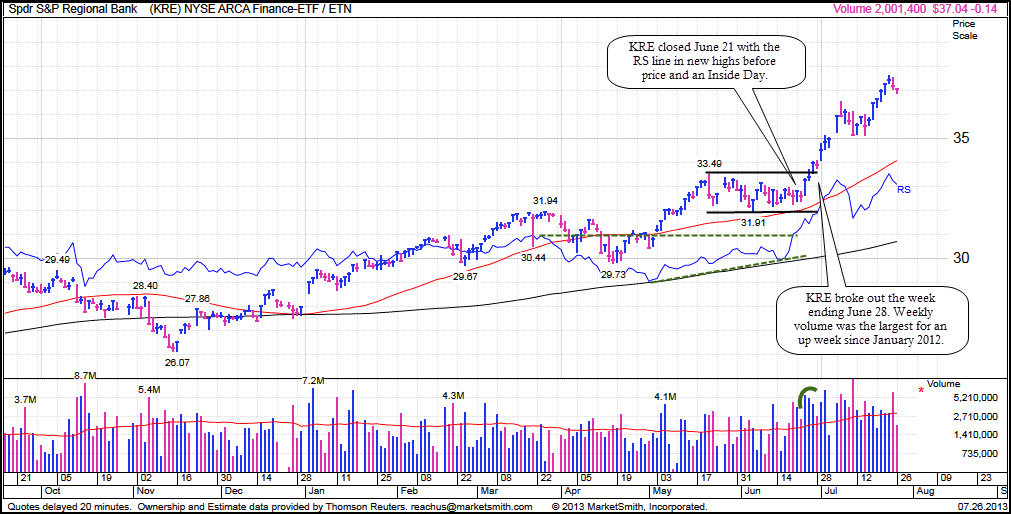
Industry groups and major equity indexes are now readying to breakout. The regional banks were one of the first industry groups to breakout and the small-cap stocks resumed printing new bull market highs well before the S&P 500. This shows that the Relative Strength Line can be applied to more than just stocks. It affords a trader the ability to establish a robust thesis about the health of the equity market.
KRE – Daily Chart
hertcapital: RS line in new highs before price. $CSIQ $ALNY $SPLK $GRA $V $HON $UNP $MCK $KEY $MBFI
27 Jun from StockTwits Web
hertcapital: RS line in new highs before price. $AMRI $ABFS $ALNY $VSAT $AXL $STX $HIG $SPLK $EXLP $MFRM $HXL $V $CGNX $PCAR
28 Jun from StockTwits Web
hertcapital: RS line in new highs at Friday’s close. $XLY $KBE $KIE $KRE $SOX $IWC $SML
30 Jun from StockTwits Web
hertcapital: RS line closed in new highs for 24 of the 197 (12%) MarketSmith industry groups. Positive RS separation broadening. Market Bullish.
30 Jun from StockTwits Web
hertcapital: RS line in new highs before price. $BGFV $ALNY $IMOS $AXL $ILMN $WCRX $EEFT $STX $NBIX $FTK $LOPE $LEA $CR $PCLN $KEY
30 Jun from StockTwits Web
hertcapital: RS line in new highs before price. $LGF $NPSP $EEFT $GWRE $PKG $OII $PCLN $KKD $MGAM $NBIX $LOPE $SGMS $CR $ENS $PCAR
2 Jul from StockTwits Web
hertcapital: Other stocks that showed the RS line in new highs before price. $MDSO $PVTB $ZION $CSIQ $ALNY $KEY $AMRI $GNRC $CR $KKD $MBFI
5 Jul from StockTwits Web
hertcapital: $SPWR $ECYT $AMRI are examples of when price plays catch-up with the RS line. Came into today with the RS line new highs before price.
5 Jul from StockTwits Web
hertcapital: RS line in new highs before price. $SAIA $NPSP $NR $ICON $HOS $N $GTLS $POL $ODFL $DRQ $M
8 Jul from StockTwits Web
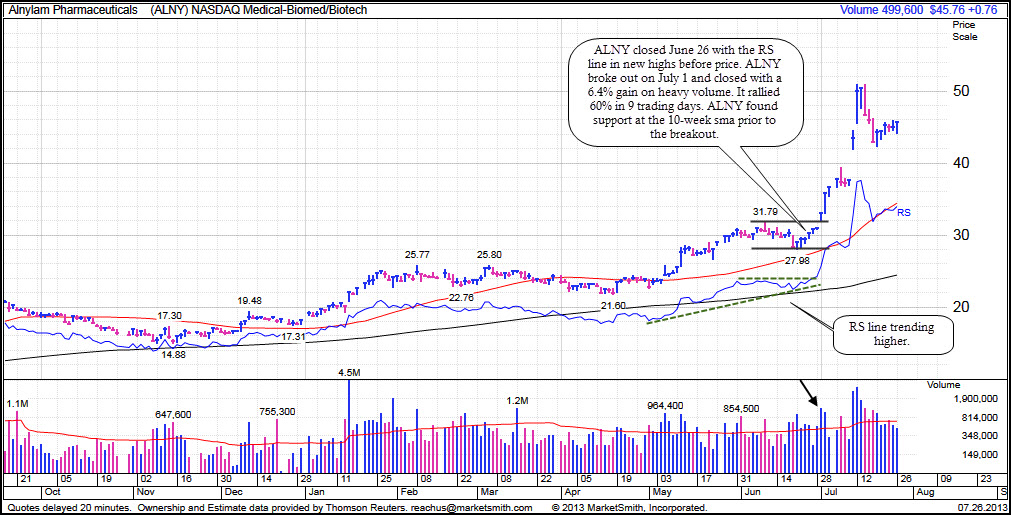
ALNY was one of the more powerful breakouts. The stock emerged from a tight consolidation area on July 1 after finding solid support at the 10-week sma when the S&P 500 had just printed the price low. ALNY emerged on June 27 when it closed with the Relative Strength Line in new highs before price. The stock is currently printing new rally highs. You had to be ready.
Note how you can use the RS Line to evaluate the MarketSmith Industry Groups. This simple analysis helps direct a trader to the industries that are emerging and guides the next level of screening. Not shown, but the next week the percentage of industry groups with the RS line in new highs rose to 16%.
ALNY – Daily Chart
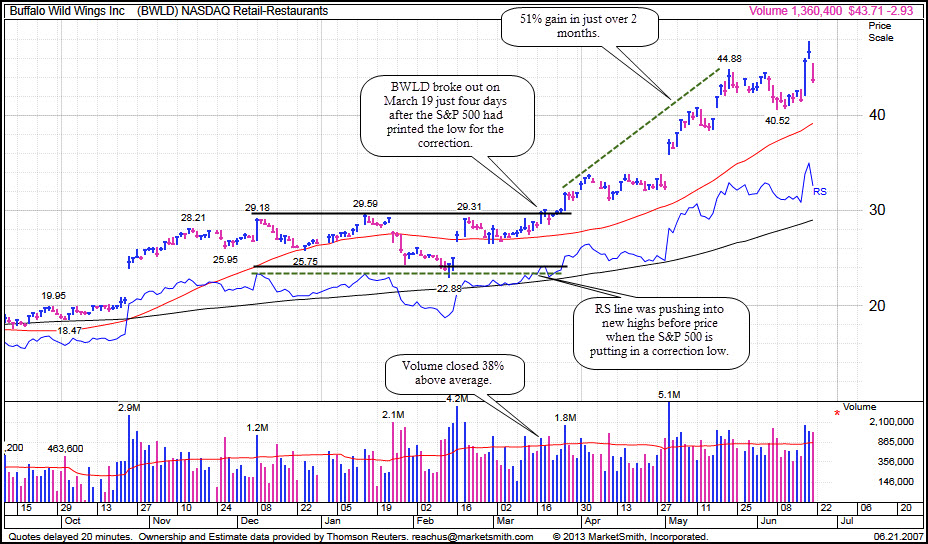
In honor of the new bone-in chicken swings at McDonald’s I posted below a historical precedent analysis of Buffalo Wild Wings (BWLD) from 2007. BWLD was showing the RS Line in new highs before price just before the March 19 breakout. The breakout was just four days after the S&P 500 had bottomed.
BWLD – Daily Chart (2007)
It is important to note that many breakout attempts will fail, but if this type of screening is done correctly there is a high probability a trader can stay ahead of the market and positioned in the right stocks during each rally.
There are more many examples in my trade workbook, but it is clear that the Relative Strength Line and the Relative Strength Rating are robust tools for evaluating and preparing for the next market advance. As with many facets of trading, a professional trader needs to mesh science with art.
The charts have been sourced from MarketSmith, Incorporated and Stockcharts.com.
Twitter: @hertcapital
Author holds a long position in ALNY at the time of publication.
Any opinions expressed herein are solely those of the author, and do not in any way represent the views or opinions of any other person or entity.


")


 Ready To Break Out?")
