 In today’s post, I want to discuss my method of risk management and how I use a modified ATR trailing stop tool for measuring risk with my day to day trading. In case you haven’t read any of my previous posts, 99.9% of my trading ideas (and recommendations to clients) are based on technical happenings in the markets. In my view, fundamentals are sort of the “story” that lags behind price and may or may not convey perceived value. But there is another factor that has emerged as the most important aspect in my trading: RISK. And this is where the Average True Range indicator comes in with the ATR trailing stop.
I know we all focus much of our efforts on FINDING opportunities and examining a vast array of price indicators and patterns to tell us WHEN to get in or out of a trade. But, there is another component that I have realized through experience is so much more important than our entry technique: staying disciplined when managing risk. When I first was developing my style of trading, I have to admit that I often neglected my focus on managing initial and existing risk. Only after making mistakes and getting consistent enough to grow my accounts while managing multiple open trading positions did I really step back and realize its importance. And now it’s clear that managing risk requires the same diligence used in our idea generation research.
As a novice trader, I studied many risk management strategies and the only “meat” that was really offered on the subject were little quips like “never risk more than 2% of your total account” or “never take a trade that is less than 3:1 Risk / Reward,” or “always trail a stop 1 tick behind the last bar.” But it was after two important realizations that I had my EUREKA! moment. I then I set out to develop my own personal methods of managing risk that fit and complimented my style of trading.
The first realization is that the market is forever and always DYNAMIC.
Websters dictionary defines dynamic as
dy·nam·ic
dīˈnamik/
adjective
adjective: dynamic
1.(of a process or system) characterized by constant change, activity, or progress
I have always sort of visualized this in terms of the Mandelbrot & Chaos model in that price action is fractal in movement and is constantly repeating itself on every scale, also there is a predictable process or path of lease resistance that it goes through similar to the growth a biological organism. Meaning the markets are alive and move up and down just like you breathe in and out and have periods of high intense movement and periods of rest. I am getting a little theoretical here because it leads to my next realization which was that after I accepted this notion that there is polarity to the market movement (*increasing and decreasing volatility expansion) I needed to mirrored this thought process in regards to how I managed risk.
Bill Williams has a great excerpt in his book Trading Chaos
“ the market is where it is because thats where it is supposed to be,
and it is supposed to be there because thats where it is”
I have long philosophized about this statement and have since considered it to be nothing less than profound. Even though he is talking about nothing specific to price action or how to measure the markets, he is illuminating one of the the key mental elements to trading: Expectation.
So, if I know the market is dynamic, and I also I know that I need to expect it to be dynamic, then my risk management approach also needs to be dynamic. This led me to transition from a static or fixed risk system (i.e. risk $100 to make $600) to one that moves with the market, and adapts to how the market is evolving. Even though so many traders and trading systems have defined risk as this fixed component to trading. I have found that if I let my risk and reward expectation adapt to current and future expectations of market change and behavior (more active or slowing to rest), I will have a much more dynamic, efficient and profitable method.
Time Decay of an Edge
Another component of risk that is often overlooked is TIME. And the time investors are exposed to risk. This is where it gets a bit more tricky…… Time is also dynamic. It took me awhile to understand this concept in that we all think of time as a static fixed period that passes by into infinity and does so at regular intervals. But I have come to believe time is a function of perspective.
Which when applied to trading can be viewed as trade half-life.
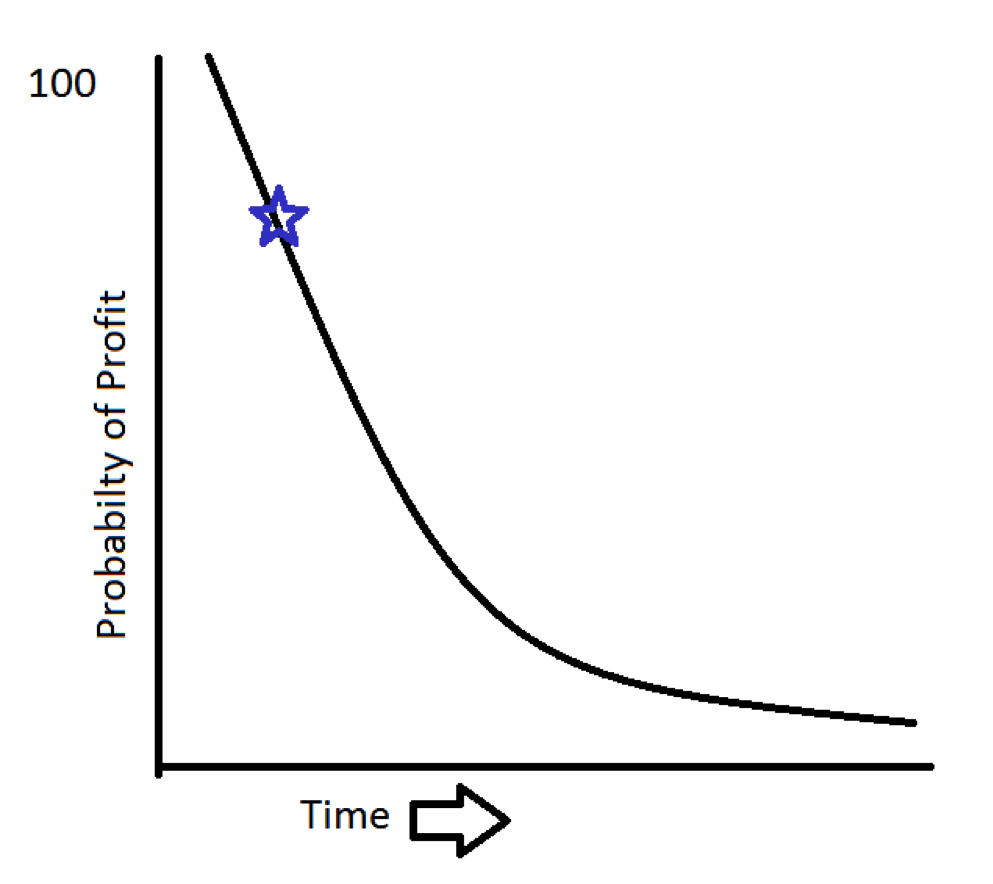
For example if you get a signal from a pattern or an indicator, this (*hopefully) has a measurable edge. Meaning having a probability that you can exploit for profit. But what I also realized is that with every moment that passes after the edge is recognized this probability will decrease till the initial edge you identified is nothing more than 50/50. In addition, my thought process has concluded that the function of this edge probability time decay is dependent on the current market environment and has various rates of decay. In my experience when markets are tired and resting the edge decay is slower than when the markets are moving fast where edges can disappear in a flash.
Above graph: At time of signal or initial edge
So how does this relate to dynamic risk management?
When you are calculating an initial risk reward expectation for a trade, it is not enough to just put the trade on, set the stop and trail for profits (if there are any). You have to take into account the current state of the market (fast or slow) and the rate of change it is exhibiting in that direction: slowing down or speeding up. Since I know that every moment I am in a trade and its not creating profits, my probabilities are falling and the rate at which this is happening is in flux with the market as whole. In simpler terms, when I’m sitting on a trade that is neither moving in my favor or against me, it is actually becoming more risky in terms of my capital being exposed to loss.
So, let’s Get Down to brass tacks…
So enough with the theory. Lets look at one fairly simple method and investing tool that I use to help manage risk.
First off, before I show you my preferred method I want to show you the standard version that many successful traders use in there charting platforms to analyze and manage risk (I will then follow with my modified version). Both revolve around the use of the Chandelier ATR Trailing stop. Stockcharts.com offers a full description about the ATR trailing stop indicator/method here.
I like this method because it is not a fixed variable like 2% or X number of bps or ticks. As well, it compliments my philosophy that the market is always in a dynamic state of expansion or contraction. Even though there is a “lagging” component in this system, I find it to be balanced in its ease of computation and effectiveness in practice. It looks at a market and inherently defines whether or not it has been recently expanding its range or contracting (by measuring historical volatility) and then shows you where the suggested correct price to account for this is away from the current price (as a stop). Example: It will suggest a price in terms of average true range distance and 1) calculate more risk acceptance when price is moving fast and expanding and 2) less when price is contracting and slowing down. Now I will add a disclaimer that there are traders that don’t work well with the ATR trailing stops for managing risk, so be sure that it fits your style. For the sake of novice and intermediate traders, I think it is a good one to learn about. Other tools that could serve similar function would be parabolic Sar, Super Trend, Expected True Range & implied / historical volatility based stops.
A few issues I have with most ATR trailing stop charting packages….
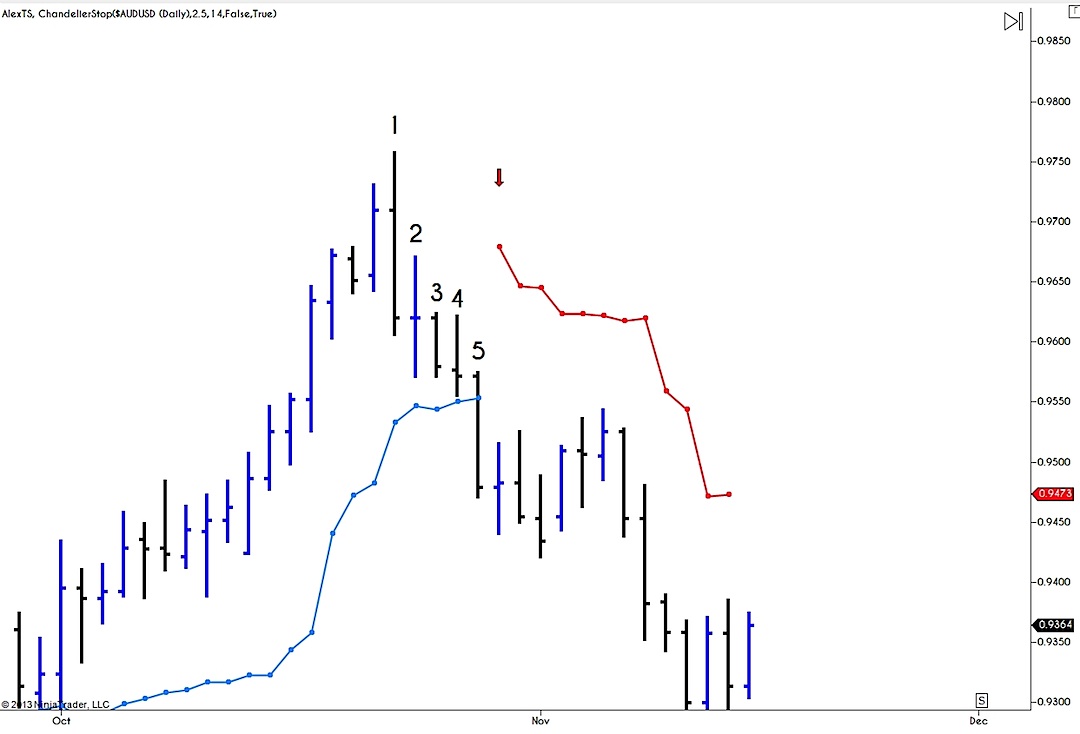
In the image below you can see a simple 14 period 2.5 Average True Range plot that trails price action as it trends. It is designed to be a trend FOLLOWING tool that will only allow aid to the user when new trend has been confirmed. As price swings from its high at bar 1 you can see it has to eclipse the current ATR line before it starts a new plot. This is a big problem for my trading style because many trades I employ are at price extremes (fading if you will…). The lag that is shown takes until the 5th bar to give me a stop calculation. This takes too many bars (time decay) and gives up too much range before it plots for me. This makes it difficult for me to start managing risk effectively when I need it most.
Aether Trailing stops Drawing tool
I have recently had a drawing tool programmed for ninjatrader that solves this issue. The difference being since many of my positions are at apex extremes of price patterns, I cant wait for price to reverse because i need to know what my ATR risk is from any bar. With this tool I can select any bar that I have executed on and see the proper. This way I am using the proper risk calculation that has minimal lag built in and allows me the freedom to have a discretionary starting plot.

In this chart you can see that if I was considering an entry trade on bars 1 or 2, the traditional ATR has no calculation for me to use until bar 5. But with the plot of Aether Stops drawing tool I can see the appropriate levels for the stops I have predefined at any bar.
Method
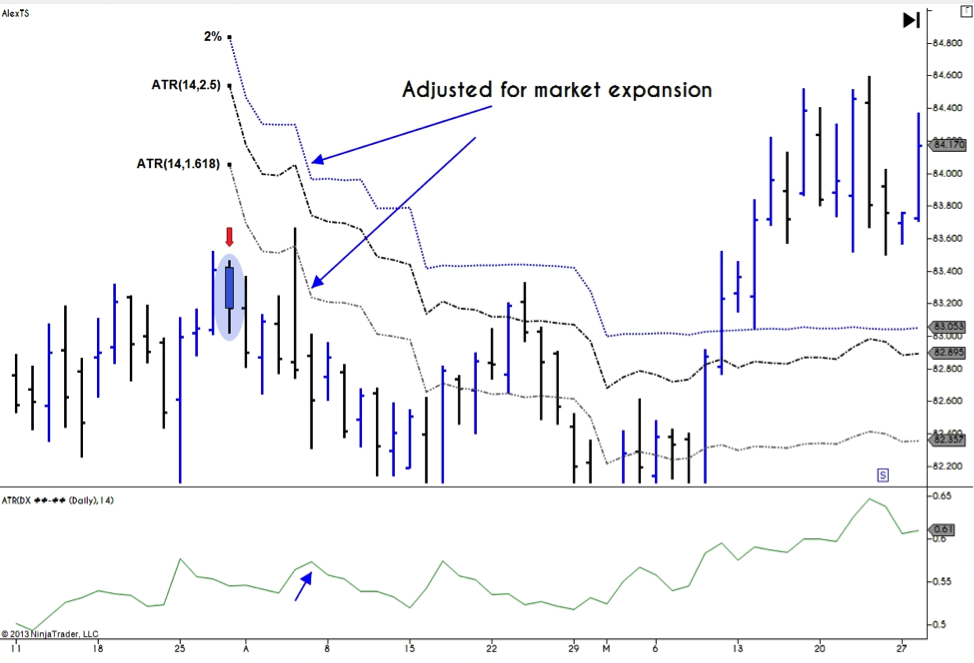
I always use two to three different levels for each individual trade because as a trade evolves I often take ⅓ off at a level that pays for the position or break-even. This means that if after I take profits on this first position, I would have paid for the losses on the remaining ⅔ if it gets stopped out. This way I am sort of playing with the houses money. The second ⅓ piece I trail at 1.618 ATR and the remaining at 2.5 ATR (note that I have often used the combo of 2.5 and 3.0 ATR on longer term holding positions where I have longer range time targets). In most cases some variation of 14 to 21 periods and 2.5 to 2.618 ATR is a great initial setting for primary swing moves.
ATR Trailing Stop – Risk Aversion Built in.
Another great aspect of this tool is that if price starts to consolidate and moves to a stagnate or range bound state, the ATR decrease will cause the stop level to close in on the current price price thus decreasing the risk you have exposed and accounting for the time decay of your edge probability.

The same works for when price sees an expansion. It will adjust the risk level to reflect the changing market action.
This sort of flys in the face of some of the most strongly held risk management beliefs around: “Never move a stop away from the original level.” I understand the caution, however, as new data is evolving in a trade (and when I have evidence that my target could be adjusted to reflect larger expectation), I think it is proper to allow for slight adjustments in risk to reflect those changes.
Closing Thoughts
Remember having perfect discipline – not perfect strategy – is the key. If you can see the current state of the market expanding or contracting then in terms of both stops and targets you can act in a more disciplined manner when it comes to risk management. Additionally By being disciplined I don’t mean being fixed in your expectations but rather adjust your expectations in a systematic way based on the eternal flux of the market as well.
Summary Points
– The market is either expanding or contracting at all times
– Your “edges” for trade entry have a half–life (time limit)
– Your risk should adjust to reflect state of change that the market is currently in.
– Focus more on how much can I lose. Rather than how much can I make and your performance stats will likely increase.
Note as well that I am developing a revised version of the Aether Stop Loss Drawing Tool that will hopefully be available for purchase after NinjaTrader 8 is launched. At a minimum, I hope you learned something about managing risk and the ATR trailing stop method.
Twitter: @InterestRateArb
Any opinions expressed herein are solely those of the author, and do not in any way represent the views or opinions of any other person or entity.


")


