
By Dana Lyons
It is a distinct pleasure and honor to participate in the Market Masters series on See It Market. I sincerely appreciate the invitation by Andrew Nyquist and Andrew Kassen to take part. The depth and quality of past contributors to the Market Masters series is superb. Furthermore, as an open resource for traders and investors, the quality and quantity of content posted on See It Market on a daily basis is unsurpassed. I highly recommend it for everyone involved in financial markets.
In our asset management practice, J. Lyons Fund Management, Inc., and our subscription service, My401kPro.com, our focus is on the intermediate-term duration when considering equity investments. By that, I mean periods typically measured on the order of months. This is the shortest duration in which we feel markets undergo moves substantial enough to attempt to exploit (on the upside) or avoid (on the downside). In this piece, however, I am going to focus on the BIG picture, namely the secular, or long-term, cycle. The secular cycle is measured in years, or even decades. Specifically, this piece covers the secular cycle in equity valuations.
As most market observers may be aware, the standard measure of equity valuation, whether on an individual stock basis or market-wide, is the Price/Earnings ratio (P/E). We rarely look at valuations when implementing our strategy as we feel, particularly on an intermediate-term basis, valuation is not a catalyst for stock or market moves. Rather, moves are primarily the result of investor psychology, driven by momentum and supply/demand factors. However, on a long-term basis, valuation extremes can be fairly accurate markers of secular stock market tops and bottoms. The focus in this piece is on identifying the structure of durable secular bottoms in valuations.
Given that secular valuation extremes only occur once every other decade or so, I understand that this topic may not be of the highest magnitude of relevancy for intraday or swing traders. Furthermore, the notion is also not lost on me that stock market valuations are not currently near such a secular bottom. Valuations are, in fact, closer to the opposite extreme. However, the (perhaps surprising) conclusion to this study may have relevance in identifying the future investing environment. Furthermore, it may have profound relevance to those investors with long horizons and/or those tasked with allocating substantial sums of money.
P/E Ratio and the Secular Market Cycle
This chart shows the real (inflation-adjusted) price series of the S&P Composite versus its real Price/Earnings ratio from 1900 to 2014. The S&P Composite is essentially the present S&P 500 with prices recreated prior to its inception date in the 1950’s with available stock data from that time. Both the Composite data and Earnings data come from Yale Professor Robert Shiller’s site.
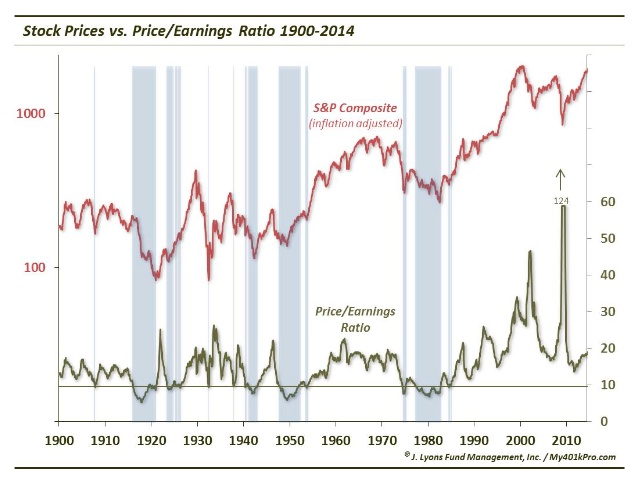
As shown by the lines on the chart, P/E readings below 10 (blue lines) have often marked secular lows in the S&P. By a secular low, we mean a low in the stock market that precedes a sustainable, long-term move higher in stocks. For example, the low in 1932 in the aftermath of the 1929 crash marked the absolute low in the stock market for that cycle. However, stocks generally continued to move sideways for another 17 years. It was not until after the low in 1949 that the market was able to move higher on a long-term, sustainable basis.
The problem with using the P/E to identify secular lows is that it also hit low extremes at times that did not mark secular lows (e.g., 1932). So what characterizes valid, durable secular lows in the stock market? Since they are marked by extremely low P/E ratios, they involve some combination of low Prices and high Earnings. By isolating the two variables, Price and Earnings, we have found that durable secular lows in the market involve contributions from both low Prices and High Earnings.
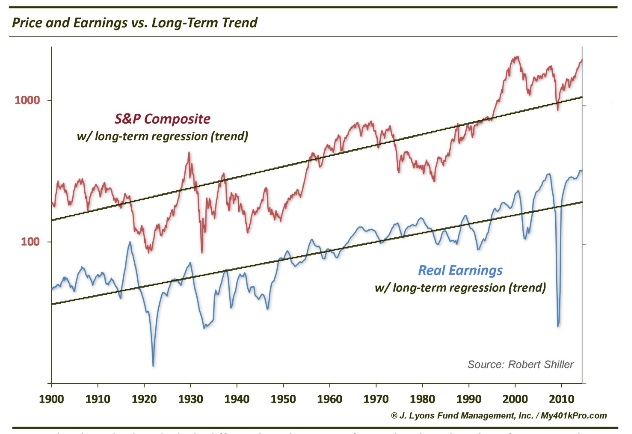
How can each series’ contributions be quantified? By measuring each series versus its long-term trend. This chart displays Price (S&P Composite) and Earnings versus each of the series’ exponential regression lines. The regression lines measure their long-term trend and, thus, we can measure how far above or below trend they are at a given time.
Here is the chart displayed a little differently, in histogram form. The plots show how far Price and Earnings are above or below their long-term trends. Also plotted is the Price/Earnings Ratio. By viewing the series in this manner, we can start to get an idea just how much the extreme P/E lows are being influenced by low Prices as opposed to high Earnings.
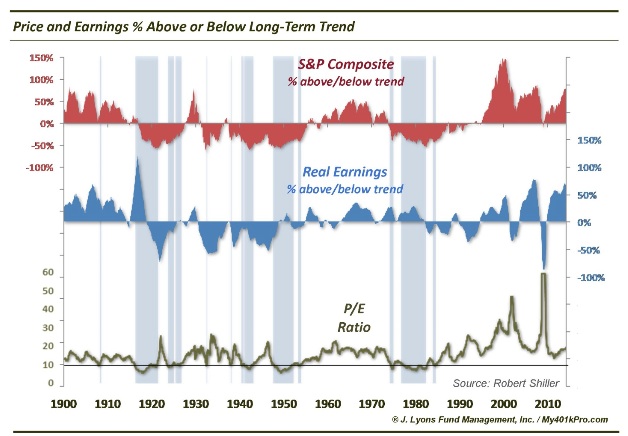
Extreme low P/E readings in 1932 and 1941 were entirely a result of depressed prices. Conversely, P/E lows in 1907 and 1916 were completely a function of elevated earnings levels rather than below-trend prices as well. None of these extreme P/E lows constituted a sustainable secular low in the stock market.
On the other hand, P/E lows in 1921, 1949 and the early 1980’s accompanied valid, durable secular lows. The commonality among the structure of those P/E readings is that they were a combination of above-trend Earnings and below-trend Prices. This combination represented a market environment that was capable of sustaining a new, durable secular bull market.
Here is another chart to further visualize this dynamic. It plots the Price and Earnings’ distance above or below trend only for those periods during which the P/E ratio was at an extreme low, i.e., below 10. The P and E above/below trend is plotted as a 100% stacked area chart. This way, it is easier to see how much each variable is contributing to the low P/E readings.
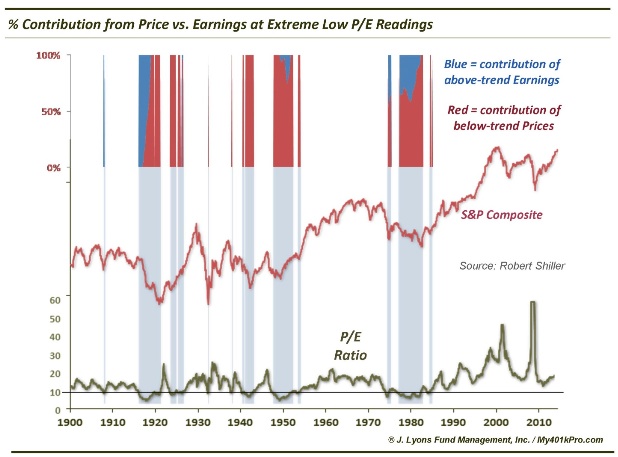
The low P/E readings that did not accompany a secular market low were products of one-sided P or E contributions. That is, they were either solely a product of depressed Prices or elevated Earnings. Thus, the area chart appears as all red or all blue. Conversely, those low P/E extremes that produced valid secular market lows were some combination of low Prices and elevated Earnings. Thus, those points appear as a mixture of red and blue on the chart.
Conclusion
So we have established that those extreme low P/E readings that lead to durable secular market lows are a product of both Price and Earnings. What is the present usefulness in this discovery? Given that P/E levels are currently closer to extreme highs than lows and given that the stock market has seemingly long since left the confines of the post-2000 secular bear market, it is a very pertinent question. Our perhaps surprising answer is that – the secular bear market may not be over.
Throughout time, we see that markets are sensitive to the laws of physics. One law that we have referenced relative to the markets is Newton’s 3rd Law of Motion: for every action, there is an equal and opposite reaction. When markets become stretched to an extreme in one direction, they tend to eventually revert to the opposite extreme. Given the excesses that were built up during the secular bull market culminating in 2000, it would be expected that market metrics would visit the opposite extreme before the secular bear market had run its course. In fact, it would be unprecedented if they did not. That has not yet happened.
For instance, after reaching unparalleled heights during the preceding secular bull market, the lowest level the P/E ratio reached during the secular bear market was 13.5. That is a far cry from prior secular bear markets which featured a secular P/E low near 10 and certainly no “equal and opposite” reaction to the secular bull market readings which reached the 30s for the first time in history.
Does that mean that we think the stock market is destined for new lows below those set in 2009? That is not our expectation. Remember, our definition of a durable secular market low is one that supports a sustainable secular advance. That means that prices need only revert back to the secular bear market range established between 2000 and 2013 to render the current rally “unsustainable”. In the S&P 500, that would mean a return to the 1500’s area that marked the tops in 2000 and 2007. This, we believe, is not out of the question. Nor is it unprecedented. Similar temporary new highs have occurred during prior secular bears in the 1910’s and in the early 1980’s.
Such an eventual move, should it occur, will hopefully generate the types of low extremes commensurate with the excessive levels attained during the last secular bull. That would include seeing the Price/Earnings ratio fall below the 10 area. In such an event, we will be on watch for evidence that the low reading is a product of both above-trend Earnings and below-trend prices. Although, there is no telling how it will behave during a market correction back to the secular bear range, the Earnings side of the equation is in good form at the present time. However, Prices are still well above trend at this time. In fact, they are not far from 100% above the long-term trend. Therefore, to get Prices back below trend would require a market correction of nearly 50%.
While we are not forecasting that type of an imminent move, we would not be surprised to see Price correct back to its long-term trend at some point in the remainder of this decade. Remember, it would be unprecedented for it not to. This does not have to come via a 50% crash. It could be through some combination of stagnant or declining prices and a long-term trend that will be slowly but steadily rising over the next several years.
Should this scenario unfold over the remainder of the decade, what is the ultimate takeaway? As I mentioned, for daytraders and swing traders, and even intermediate-term duration managers with an active risk-management approach, the impact may not be significant. Sure, the micro-trading environment may be different, certainly, than it has been these past 2 years. But the short-term market dynamics are always evolving. Additionally, the share of opportunities may sway more toward the short side versus the long side. At least they should become more balanced than during the recent market that has gone straight up. But for those with a short-term horizon and a risk-conscious approach, the tactical challenges will be essentially the same as always.
However, the landscape will be vastly different and more daunting for those investors and entities with longer-term investment horizons, whether due to their duration preferences or the realities associated with allocating massive amounts of money. It may be the 401(k) investor that bailed out of stocks in 2009 and still has not returned. Or it may be a sovereign wealth fund manager tasked with deploying billions of long-term capital. Whoever it is that is presently considering deploying a substantial portion of their portfolio to stocks at this time, we would take great pause.
We are first and foremost risk managers. Therefore, we put great weight into both the potential reward and the potential risk when considering an investment, including as it pertains to the duration of that investment. Given that consideration, our view is that there will be periods over the remainder of the decade that will offer substantially better risk to reward opportunities in the stock market than that which exists today.
 Dana Lyons is a partner at J. Lyons Fund Management, Inc., a Registered Investment Advisor and founder of My401kPro.com. He is a veteran of nearly 20 years in the investment industry as a portfolio manager, analyst and commodities trader and is an original Yahoo Finance Contributor. Dana has a Bachelor of Science degree in Economics with a major in Finance from the Wharton School of Business at the University of Pennsylvania where he was also an All-Ivy League football player. He lives in Chicago with his wife, Dana (seriously, same name) and 3 children. (DL: “Our oldest child is 3…did I mention I’m a manager and not a planner?”)
 Rolling Over At Key Fibonacci Level?")


 Rolling Over At Key Fibonacci Level?")

