The S&P 500 has dropped roughly 12.5 percent from highs to lows over the last couple of months or so. Not surprisingly, this decline has given new life to the word “correction” as sentiment has become bearish and uncertain.
And many are now pounding the table for the start of a bear market.
Well, the good news is that we have tools to help us better understand if this stock market decline is about to get even worse… or possibly turn into a bear market.
The chart below looks at the S&P 500 over the past decade. As you can see, the S&P 500 has formed a nice rising channel (A) over the past 5 years. Any violation of this lower trend line would be very concerning and signal that lower prices lie ahead.
S&P 500 Bull Market Channel Chart click to enlarge
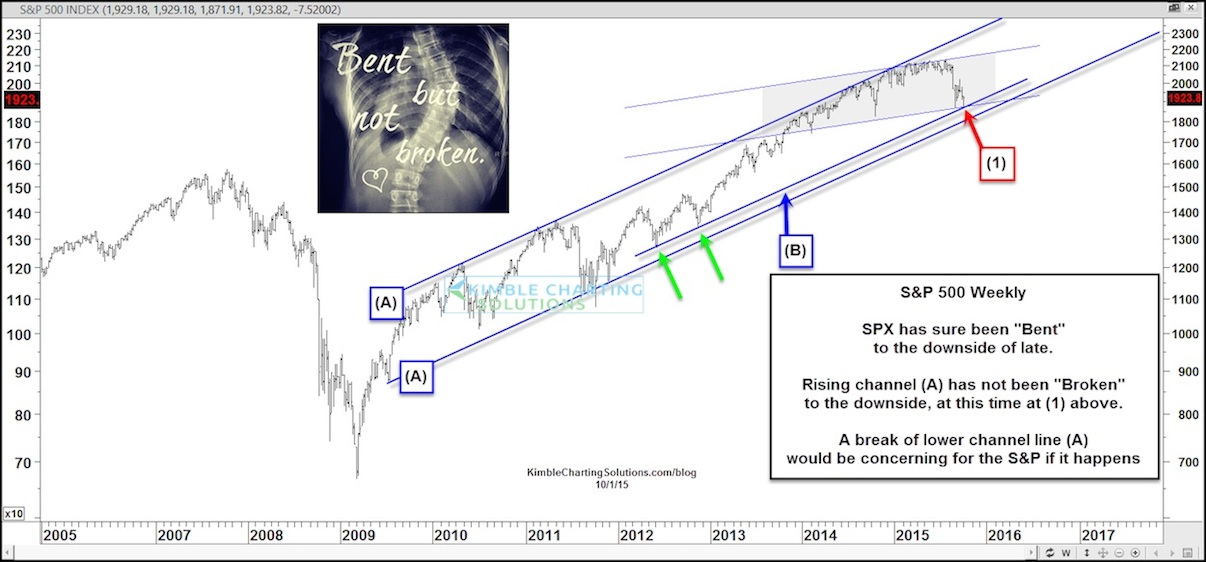
The stock market correction has taken the S&P 500 down to a parallel channel support line (B). And if you follow line (B) across, you’ll notice that stocks are ALSO testing their rising two year channel support line – shaded gray at point (1).
As I like to say, support is support until it’s broken. And while a break of trend line (B) would be concerning, a break of trend line (A) would be alarming. That lower trend line comes into play about 1800 (about 5-6 percent lower than current prices).
That’s the most important support area currently for the bull market. And should the stock market break to new lows, I’ll be watching that level closely… as a breach of 1800 would bring us one step closer to a bear market.
Trade safe and thanks for reading.
Twitter: @KimbleCharting
Any opinions expressed herein are solely those of the author, and do not in any way represent the views or opinions of any other person or entity.

 Rolling Over At Key Fibonacci Level?")


 Rolling Over At Key Fibonacci Level?")