 Thus far, 2015 has been the year of the rangebound market. The 2100 level on the S&P 500 has proved to be a tough nut to crack. But as I have been writing about for much of the first half of 2015, investors shouldn’t be surprised by this. We had a huge run in 2013, another up year in 2014 with defensive sectors taking the lead. And 2015 has been about sorting through the confusion of volatile commodities and bonds markets.
My favorite set of macro indicators this year have revolved around market breadth. Now these indicators typically don’t help you make short-term trades, but they do help you to define and understand your risk.
Market breadth indicators have been weak (or getting weaker) for the better part of 2015. And this has helped to contain the otherwise resilient equities. In fact, I’m surprised that equities have remained above the February lows. In fact, even with this mornings swoon, the lows of today are still above the March lows! So while poor market breadth indicators are a big reason why the market can’t get traction on the upside, it’s worth noting that equities are putting up a fight.
So what does this mean short-term and intermediate-term?
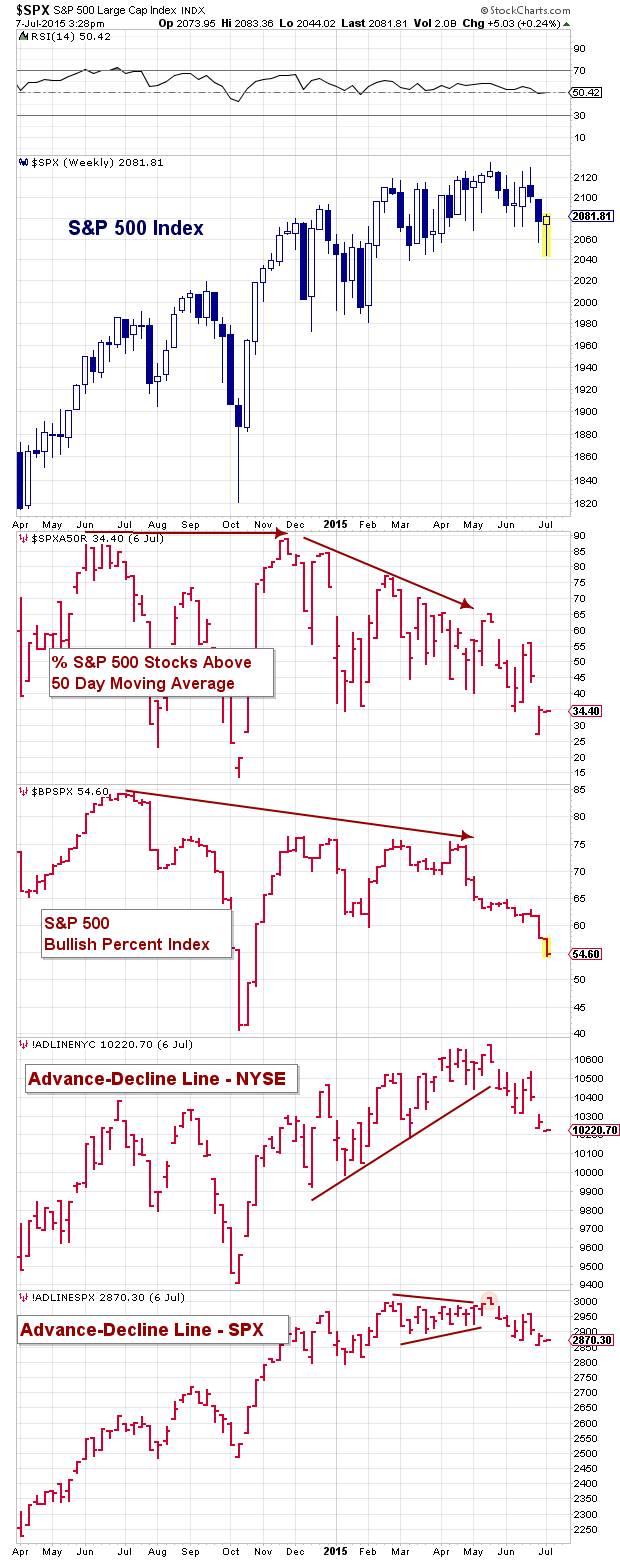
The bounce today is understandable. As you can see in the chart below, the percent of stocks above the 50 day moving average fell into the 20’s and well below the January lows. There’s room to head further south (see October) but this is an area where markets tend to bounce or firm. As well, the daily Relative Strength Index (RSI) reading touched into the 30’s last week (and it was there earlier today sans intraday rally). These signs don’t necessarily equate to a low, but they do give traders something to trade against as the market tries to stem the decline.
The S&P 500 and NYSE Advance-Decline Lines have turned lower. This broad-based market breadth indicator is still above the January lows, but needs to bear watching. Any further rollover would warn that the summer doldrums will be anything but. It’s also worth noting that the Bullish Percent Index (stocks with a Point And Figure buy signal) has slipped below the January lows.
Market Breadth Indicators
Trade safe and thanks for reading.
Twitter: @andrewnyquist
Any opinions expressed herein are solely those of the author, and do not in any way represent the views or opinions of any other person or entity.
 Rolling Over At Key Fibonacci Level?")


