NYSE margin debt came out last week and it is worth taking a closer look at what it could be telling us.
First things first, the theory goes as margin debt gets higher, this is a sign of excessive optimism. Once things turn ‘bad’ all that margin will turn into margin calls and with it an impending market crash. I’m not quite so dour about things here, but there are some major alarms.
I’ve long been in the camp that the trend of margin debt is more important than how high it is.
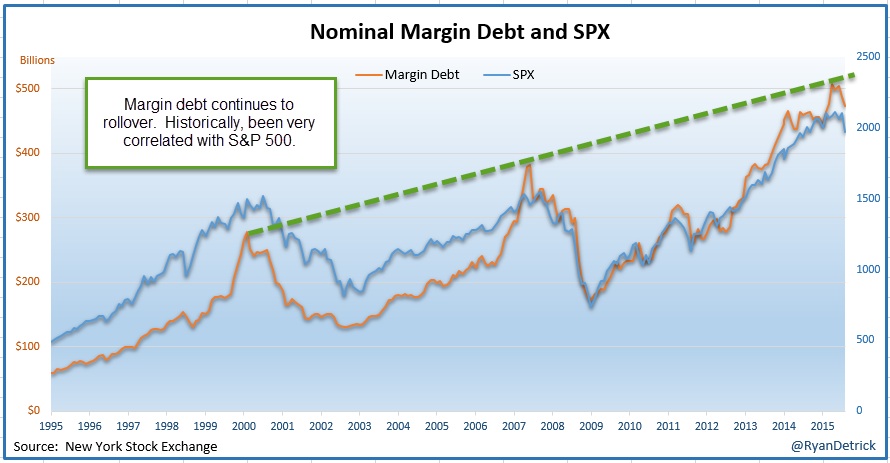
Going back 25 years, I found margin debt and the S&P 500 Index have been 89% correlated. Most of 2013 and 2014 we’d hear how margin debt was high and this was bearish for stocks. Of course, that wasn’t true as the bull market continued to grow along with margin debt.
Now we have a different picture. Margin debt peaked in April and has since rolled over. Stocks peaked in May and have since corrected. What I find simply fascinating is margin debt peaked right at this trendline connecting the two other major peaks.
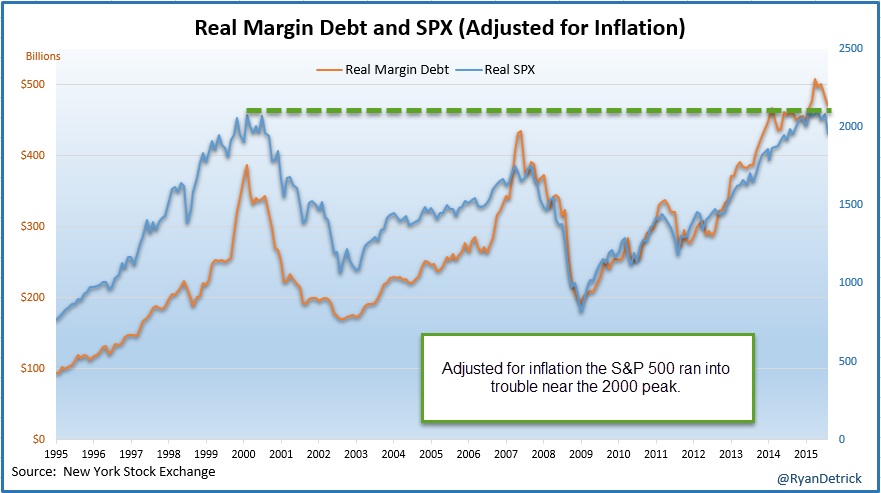
That is nominal margin debt. I like to factor in inflation to get a more apples-to-apples on things. Doing this shows it once again peaked at an all-time high, but more incredibly the S&P 500 peaked right at the year 2000 peak. Coincidence?
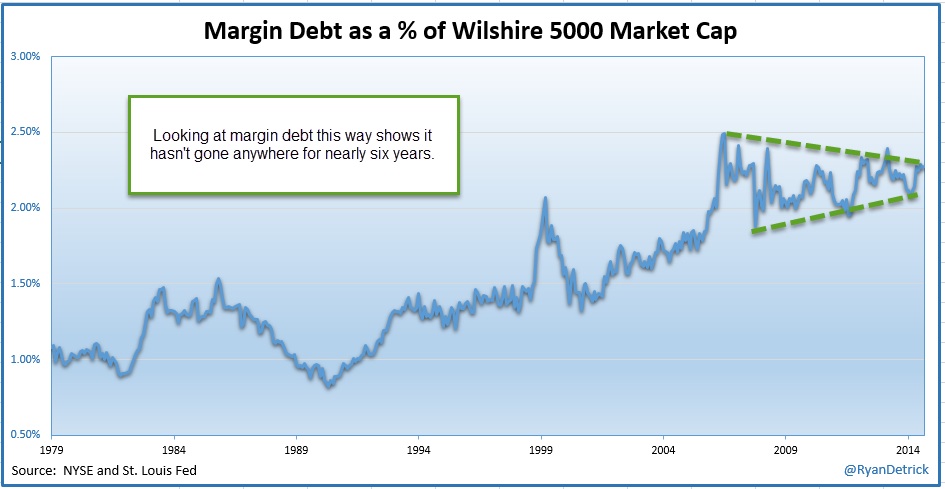
Now, it is important to remember the stock market is higher now than it was in previous years. Looking at margin debt as a percentage of the entire market shows we actually didn’t make a new record. In fact, it hasn’t gone anywhere for nearly six years!
Lastly, we tend to see huge surges in margin debt at major stock market peaks.
continue reading on next page…


")
 Rolling Over At Key Fibonacci Level?")
")

