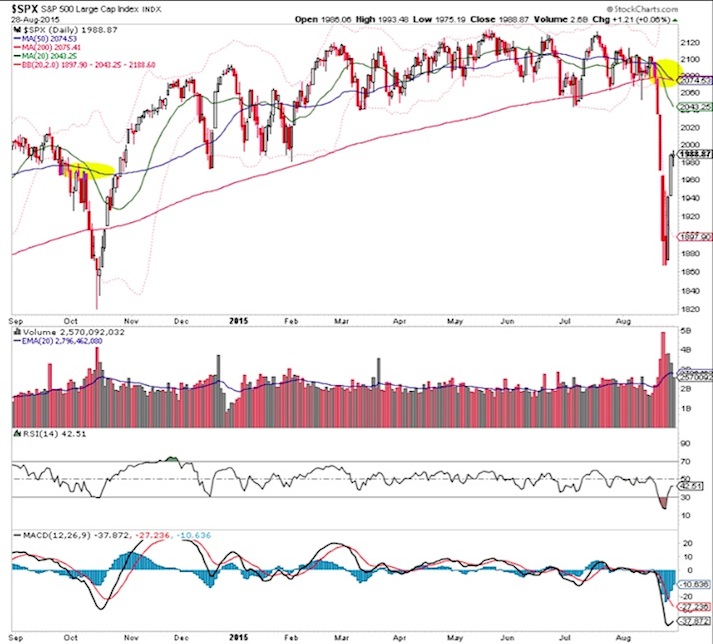
No doubt, last Monday’s open marked important lows across the globe. Maybe we won’t see them for awhile. But downside momentum for stocks has been strong and we haven’t even broken meaningful breakdown pivot levels yet. Let’s not get ahead of ourselves with ‘but nobody is expecting a V bottom’ talk.
There is a lot of overhead supply out there. The markets are linked globally for now and price action is loose. That tells us all we need to know about market conditions. Over the last few weeks we’ve shifted from late stage bull market conditions to bear-like market conditions. We need time to recover. Particularly with the now down sloping moving averages on several time frames in the S&P 500 and other stock market indexes.
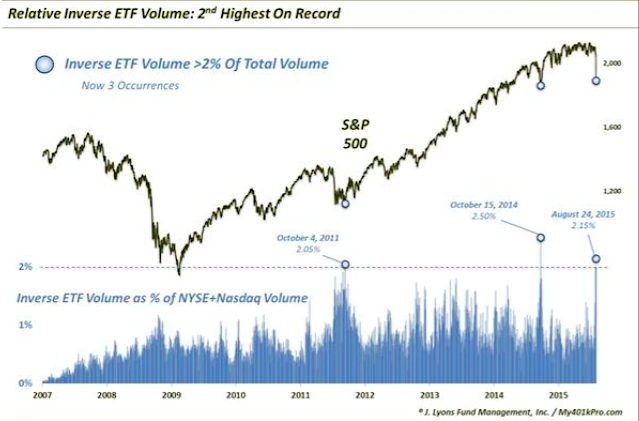
Dana Lyons points out that the interest in inverse ETF volume is near a record. Some of that can be attributed to the shifting long term tectonics of the market. That said, the last peak this high was last October’s low.
The biggest theme of note is the rally in commodities. A strong El Nino is coming and it can cause some weather disruptions across the globe. They tend to affect mostly agriculture commodities but it adds uncertainty and risk for shorts. At the same time, commodity dependent countries formed key reversal weeks at major support zones. There might be some legs to this move.
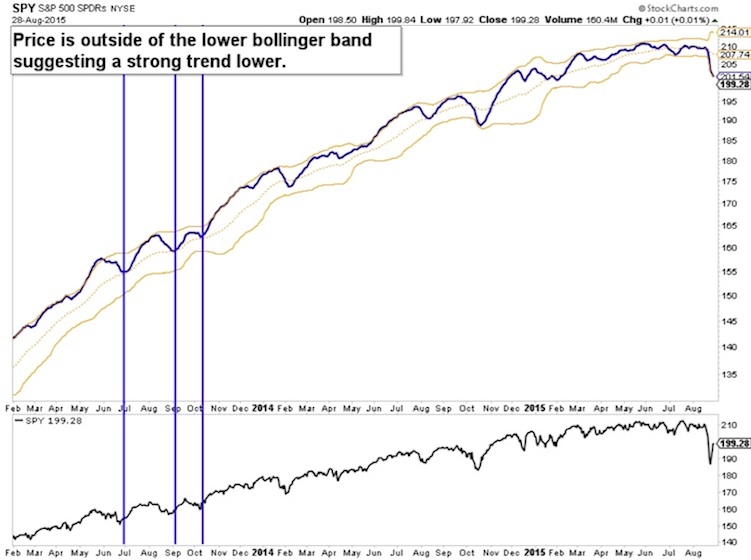
Measuring the Market
The Smoothed S&P 500 ETF shows the strength of the recent downtrend.
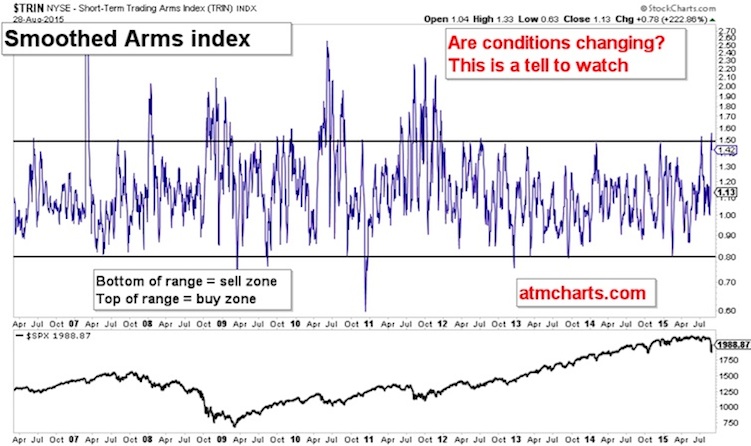
I was shocked to see the smoothed Arms Index is still not really breaking out of the recent four year range.
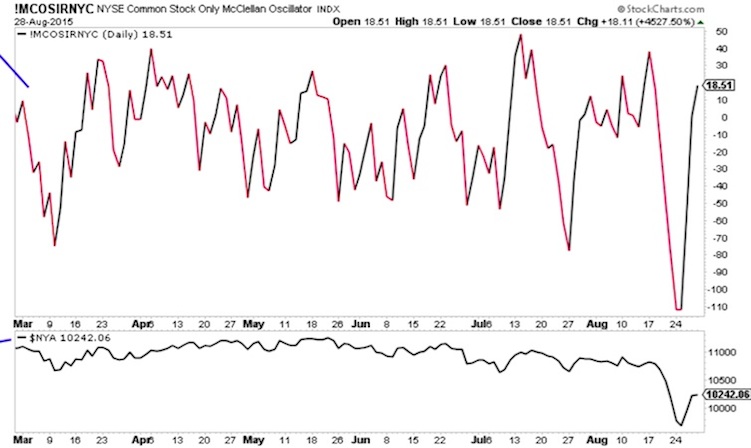
The NYSE stocks only McClellan Oscillator is already nearing a toppy level after the massive drop early in the week.
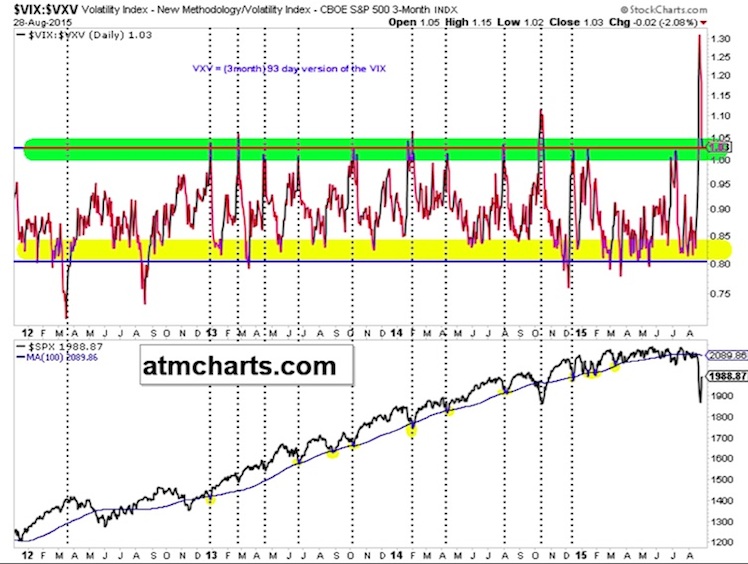
Volatility Term structure is still screaming with fear. It’s absolutely not an ‘all clear’ signal for a V shaped rally in stocks.
Commodities
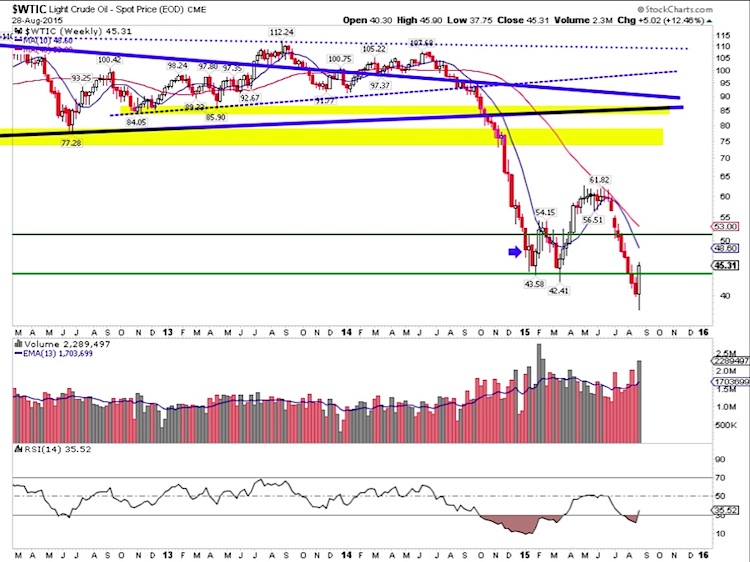
This week we saw an important changing of the guard. The major laggard within the commodity group led the rally (crude oil). It was a major inflection week in the space.
Not only did we see massive rallies, but the news and deal flow has also been off the hook. Carl Icahn steps into more Freeport McMoran shares. As well, Schlumberger is buying Cameron International. And lastly, Goldcorp is merging a major project with Teck Resources. Smart (or so it appears) managements are stepping up to the plate here.
All of a sudden Crude Oil has may be attempting to bottom here.
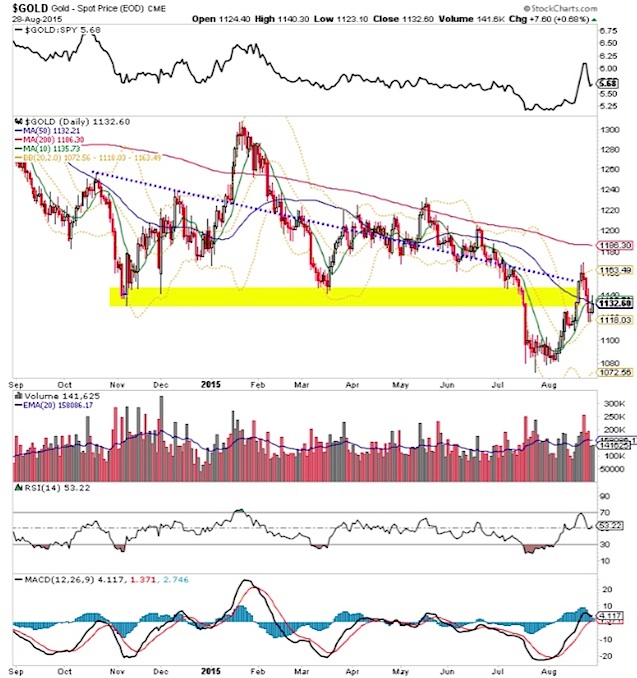
And here’s a look at Gold prices.
You can read more of my work on my blog, ATMcharts.com. Thanks for reading, and careful out there.
Twitter: @ATMcharts
The author currently carries exposure directly related to mentioned securities in DWTI and SPXU at the time of publication. Any opinions expressed herein are solely those of the author, and do not in any way represent the views or opinions of any other person or entity.

 Rolling Over At Key Fibonacci Level?")


