At 223,000 non-farm jobs, the June employment report was softer than expected. Plus, both April and May were revised lower. These are months in which kids are entering the labor force even as teachers are leaving it. So a lot of things could be at play behind recent softness. After all, in 14 of the last 16 months, north of 200,000 non-farm jobs have been created, one with a four handle and two with a three handle.
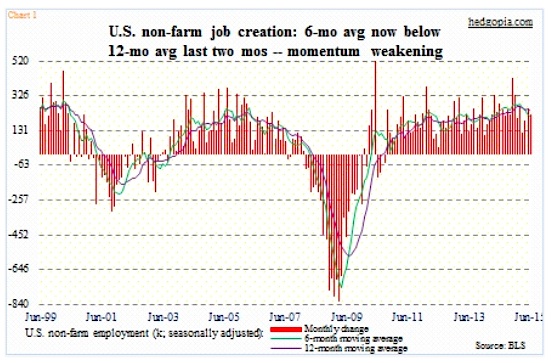
However, a closer look does reveal that momentum has shifted down with the June employment report. In the first half this year, non-farm created 1.25 million jobs. A year ago, this was 1.43 million. The chart above plots month-over-month change in non-farm payroll as well as six- and 12-month moving averages. In the past couple of months, the six-month average has crossed below the 12-month, indicating softness in momentum.
The question is, is this temporary or the beginning of a trend?
As can be seen in first chart, there have been instances in which a six- and 12-month crossover occurs but only lasts for a few months. This took place in June-November 2013, before the job market regained momentum. Ditto with July-November 2012. The longer the crossover stays in place, the higher the odds of momentum gathering momentum. That is the risk. So far, it has just been two months.
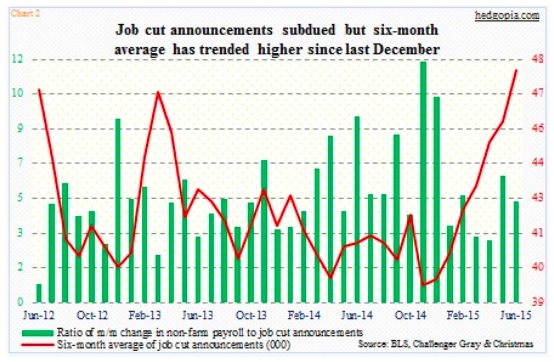
Along the same lines, job cut announcements have been subdued. June was 44,800. The green bars in the chart above are not trending lower, though June was much lower from November-December 2014 levels. They represent a ratio of month-over-month change in non-farm payroll to job cut announcements. However, the red line has definitely hooked up. This represents the six-month average of job cut announcements – 47,945 in June, up from 39,322 last November. Once again, it is not worrisome now, but will be if the trend sustains itself.
A similar message is coming from the weekly claims number.
In the latest week, unemployment insurance claims (seasonally adjusted) were 281,000, and have been gradually trending higher. This could be corroborating the June employment report. As of April 25th, claims were 262,000. The last time claims hit this low was 2000, when they bottomed at 259,000 in the middle of April.
Of course, these are historically low numbers. Claims have remained under 300,000 for 17 consecutive weeks. This compares with 21 straight weeks between February and July in 2000 before sustaining above 300,000.
In fact, except for 11 weeks, claims have been sub-300,000 since mid-July last year. Hence the risk this has gone as low as it possibly could. Having said that, back in 1972-73, claims remained under 300,000 for an extended period of time, before bottoming in the latter months of 1973. The economy contracted in 1974.
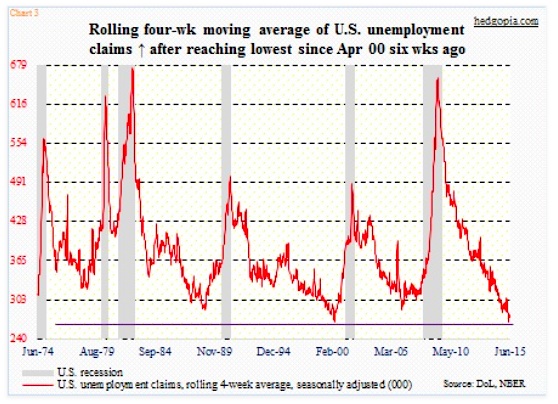
Historically, the four-week moving average of claims has tended to trough before problems show up in the economy (see chart above). For the latter to occur, the red line needs to sustainably move higher. It bottomed at 266,500 on May 16th, and has been slightly trending higher; the latest period was 274,750.
It is worth watching, as are the first two charts.
Thanks for reading!
Twitter: @hedgopia
Read more from Paban on his blog.
Any opinions expressed herein are solely those of the author, and do not in any way represent the views or opinions of any other person or entity.


 Rolling Over At Key Fibonacci Level?")
