The following is a recap of the June 17 Commitment Of Traders COT Report released by the CFTC (Commodity Futures Trading Commission) looking at COT data and futures positions of non-commercial holdings as of June 14. Note that the change in COT report data is week-over-week. This blog post originally appeared on Hedgopia.com – Paban’s blog.
Trading Insights and Analysis from the June 17 COT Report
Economic Releases
Major economic releases next week are as follows. It is a relatively light week.
On Wednesday, May’s existing home sales are published. April sold a seasonally adjusted annual rate of 5.45 million units, just a stone’s throw away from last July’s 5.48 million units – the highest since February 2007. From this perspective, sales have essentially gone sideways for nearly a year.
New home sales for May come out on Thursday. April surged 16.6 percent to a seasonally adjusted annual rate of 619,000 units – the highest since January 2008 – breaking out of a 15-month range.
Friday brings durable goods (May, advance report) and the University of Michigan’s consumer sentiment (June, final).
In April, orders for non-defense capital goods ex-aircraft – proxy for business capex – fell 0.8 percent m/m and five percent y/y to a seasonally adjusted annual rate of $$62.4 billion. This was a sixth straight y/y decline, and 15th out of the last 16. Orders peaked at $70.7 billion in September 2014.
In consumer sentiment, June’s preliminary count was 94.3, down four-tenths of a percentage point m/m. The cycle high was reached in January last year at 98.1 – an 11-year high.
Three FOMC members have scheduled appearances, including Ms. Yellen, who speaks twice – at 10AM each on Tuesday and Wednesday.
STOCKS
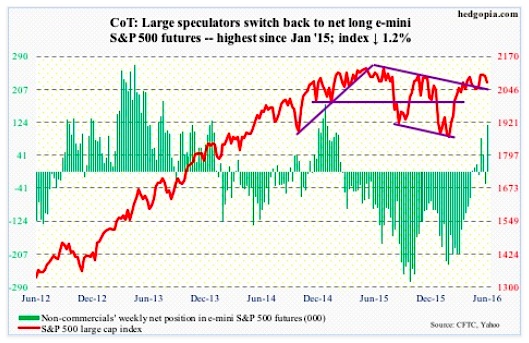
E-mini S&P 500: Through Thursday’s intra-day low, the S&P 500 was down 2.2 percent, but rallied back to end the week down only 1.2 percent.
Having lost the now sharply declining 10-day moving average last Friday, this week it also lost the 20- and 50-day. It has been on and around the latter the past four sessions.
Despite the sharp spike in the VIX volatility index in recent sessions, the S&P 500 was spared from a sharp sell-off. Kudos to the bulls! From the June 8th high through the Thursday hammer low, it lost 3.3 percent, and is only 3.1 percent from the all-time high 2134.72 of May last year.
Thursday’s action is encouraging for stocks, but for the S&P 500 to go attack that resistance again, flows need to cooperate. On this front, the record is spotty. In the week ended Wednesday, SPY, the SPDR S&P 500 ETF, attracted $1.4 billion. This comes on the heels of outflows of $71.7 million in the prior week (courtesy of ETF.com).
However, U.S.-based equity funds continue to lose funds, having lost $3.4 billion in the week ended Wednesday. This was a seventh straight weekly withdrawal. For reference, since the week ended February 10th, these funds have lost north of $47 billion (courtesy of Lipper).
Further, global investors continue to flee U.S. stocks. In April, they sold $2.8 billion worth, and $30 billion in February-April combined. Using a 12-month rolling total, April saw sales of $135.6 billion, not too far away from a record $138.9 billion this February. The last time this metric was positive was February last year.
Bulls sure hope this changes.
June 17 COT Report: Currently net short 31.8k, down 76.2k.
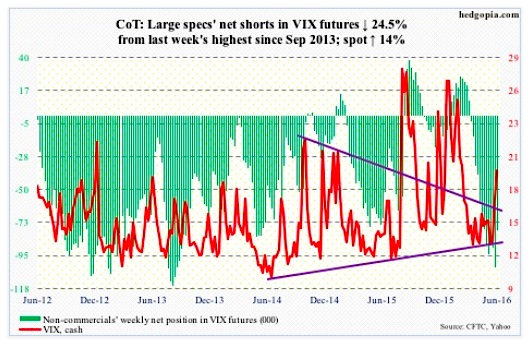
VIX: Quite a contango crash!
Back on May 27th, the VXST (nine days)-VIX (30 days)-VXV (90 days)-VXMT (six months) volatility curve was in steep contango, with the spread between VXST and VXMT negative 8.95 points. Fast forward to this Thursday, the spread shifted to positive 3.26 points.
The VIX-to-VXV ratio, using intra-day highs jumped to 0.973 on Thursday and 0.972 on Tuesday, pretty much unwinding the oversold condition it was in.
Further, spot VIX rallied north of 10 points in mere eight sessions, and Thursday may have flashed a spike reversal signal. With the caveat that next week is the Brexit vote, if it is a spike reversal, odds are decent that in the right circumstances premium can come out of spot VIX fast.
June 17 COT Report: Currently net short 78.4k, down 25.4k.
COMMODITIES
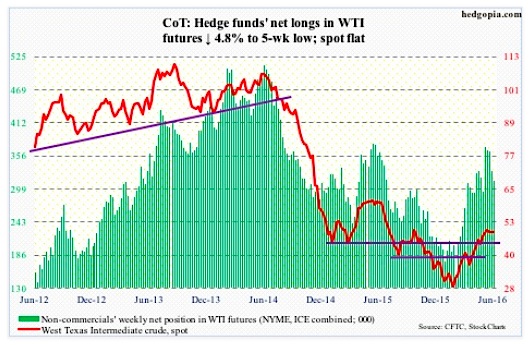
Crude oil: Oil bears tried to further build on last week’s ugly reversal on spot West Texas Intermediate crude. Crude oil at one point was down 5.1 percent through Friday’s intra-day low, before it strongly reversed, ending the week flat.
Early in the week, technicals ruled, as traders ignored good news on the inventory front.
For the week to June 10th, crude oil inventory declined 933,000 barrels to 531.5 million barrels. Inventory is now down 11.8 million barrels from the April 29th high of 543.4 million barrels, which was the highest since the all-time high 545.2 million barrels in October 1929.
Gasoline stocks fell by another 2.6 million barrels to 237 million barrels. Inventory is now down 21.7 million barrels from the February 12th high of 258.7 million barrels.
Crude production fell, too, by 29,000 barrels per day to 8.72 million b/d. Crude oil production peaked at 9.61 mb/d in the June 5th week last year.
Also under pressure were crude oil imports, down 83,000 b/d to 7.62 mb/d.
On the negative side, distillate inventory rose 786,000 barrels to 152.2 million barrels. And refinery utilization dropped seven-tenths of a point to 90.2 percent.
Crude remains overbought on the weekly chart, and shed five points from the June 9th high before approaching the rising 50-day moving average, which was vigorously defended on Friday.
There is a tremendous push and pull going on between bulls and bears. Last week produced an inverted hammer, this week a hammer.
June 17 COT Report: Currently net long 313.9k, down 16k.
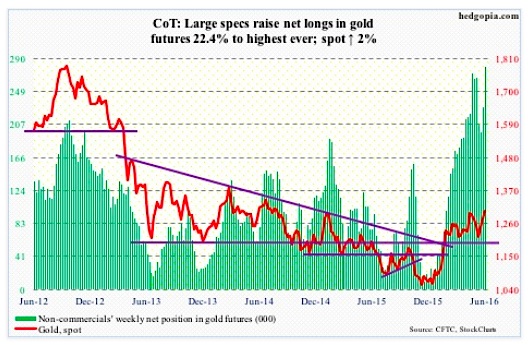
Gold: After two weeks of strong price action during which it rallied five percent, spot gold prices rallied another two percent this week. That said, it was unable to hang on to all the gains, with gold up as much as 3.3 percent before a strong intra-day reversal on Thursday.
Thursday’s intra-day high of $1318.9 was the highest since August 2014.
Gold’s rally in the first three sessions was fully supported by inflows. In the week ended Wednesday, GLD, the SPDR gold ETF, attracted $714 million, on the heels of $417 million in inflows in the prior week (courtesy of ETF.com).
Most importantly, non-commercials pushed on the accelerator this week. Ahead of the Brexit vote, net longs of gold are the highest ever.
June 17 COT Report: Currently net long 279.9k, up 51.2k.
continue reading on the next page…


