The following is a recap of the July 22 COT Report (Commitment Of Traders) released by the CFTC (Commodity Futures Trading Commission) looking at COT data and futures positions of non-commercial holdings as of July 19. Note that the change in COT report data is week-over-week. Excerpts of this blog post originally appeared on Hedgopia.com – Paban’s blog.
July 22 COT Report – Trading Insights and Analysis
COMMODITIES
Gold
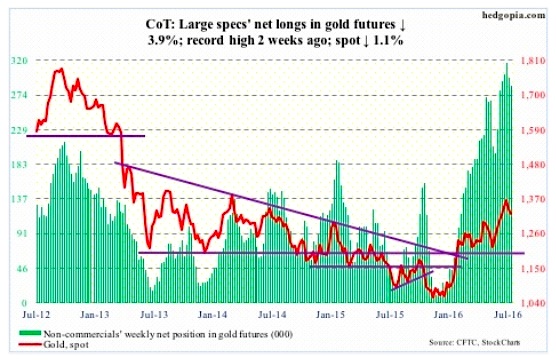
Spot gold prices on Thursday found support at 1,300-plus/ounce, which goes back to January 2011. Near-term notwithstanding, Gold’s weekly chart seems to want to go lower. The point of interest remains $1,260-$1,270, which represents breakout retest.
For the second week running the SPDR Gold ETF (NYSEARCA:GLD) failed to ignite interest. In the week ended Wednesday, it lost $1.2 million, after losing $753 million in the prior week.
Non-commercials’ net longs in Gold futures reached the highest two weeks ago, and have since been down back-to-back.
July 22 COT Report Data: Currently net long 285.9k, down 11.6k.
Crude Oil
U.S. crude oil stocks continued to decline – down 2.3 million barrels to 519.5 million barrels in the July 15th week. They are now down 23.9 million barrels from the April 29th high of 543.4 million barrels, which was the highest since the all-time high 545.2 million barrels in October 1929.
Distillate inventory fell as well – by 214,000 barrels to 152.8 million barrels.
Refinery utilization rose nine-tenths of a point to 93.2 percent – the highest since November 27th last year.
Gasoline stocks, however, increased 911,000 barrels to 241 million barrels – an 11-week high.
Crude oil production rose as well – by 9,000 barrels per day to 8.49 million b/d. This was the second straight week-over-week increase after oil production dropped to 8.43 mb/d two weeks ago. Production peaked at 9.61 mb/d in the June 5th week last year.
Crude oil imports rose by 293,000 b/d to 8.13 mb/d.
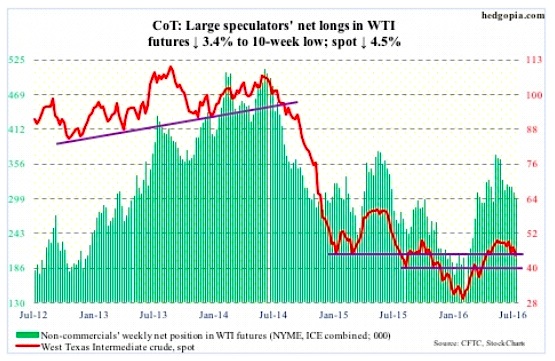
During the five sessions prior to Friday, spot West Texas Intermediate crude oil traded around the declining 10-day moving average before pulling away yesterday. Daily conditions are oversold, but the weekly chart has downside risk still, with support at $42.50-$43. The spot just had a bearish MACD cross-under.
July 22 COT Report Data: Currently net long 299.3k, down 10.5k.
EQUITIES
S&P 500
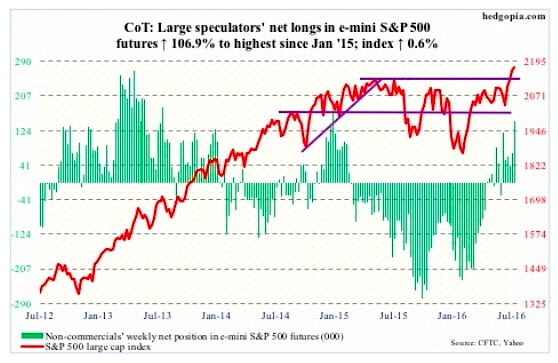
E-mini S&P 500: Was it just a blip? Last week’s inflows into U.S.-based equity funds, that is. Looks that way. Early last week, the S&P 500 Index (INDEXSP:.INX) broke out; by Wednesday, these funds attracted $7.7 billion (courtesy of Lipper). This was a first positive week in 11 weeks. This week, the prevailing trend exerted itself, with outflows of $2.8 billion. Since the week ended June 29th (the S&P 500 reversed on the 27th), $3.2 billion has been redeemed.
The SPDR S&P 500 ETF (NYSEARCA:SPY) shows a similar trend. In the week ended Wednesday, $1.1 billion left the ETF. This was post-breakout. In the prior two weeks, $12.9 billion came in cumulatively (ETF.com).
For the breakout to hold, and/or build on it, flows need to cooperate. This week’s pattern is not encouraging. Particularly so as the index remains grossly overbought on a daily basis. Weekly indicators are now overbought as well.
July 22 COT Report Data: Currently net long 146.2k, up 75.6k.
VIX Volatility Index
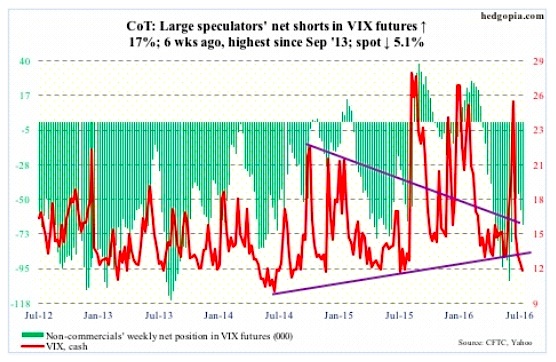
The spot VIX Volatility Index (INDEXCBOE:VIX) stayed under 13 in the past seven sessions, twice under 12. The last time it traded under 12 was in August last year. In fact, back then it briefly went sub-11, right before surging.
This week, VIX did break nine-month support at just under 13, but longer-term support at just under 12 has held – so far. On a daily basis in particular, the spot is way oversold.
This is reflected in the VIX-to-VXV ratio, which has remained in oversold territory in the past four weeks, with two of them in the low 0.80s and two in the mid to high 0.70s. It closed the week at 0.76 – the lowest since August 2012. There is a lot of unwinding left in this thing. Ditto with the volatility curve.
The VXST (nine days), VIX (30 days), VXV (three months), VXMT (six months) curve is in steep contango, completely reversing the steep backwardation it was in on June 24th. Markets are expecting higher volatility in the outer months.
July 22 COT Report Data: Currently net short 66.7k, up 9.7k.
This Week’s Economic News & Releases
On Tuesday, FOMC meeting begins, and concludes the next day. There is no press conference scheduled. After this, there will be three more left this year – September 20-21, November 1-2, and December 13-14, with press conference scheduled for September and December.
Also on Tuesday comes out the S&P/Case-Shiller home price index (May) and new home sales (June).
Home prices, on a national level, increased five percent year-over-year in April, and have risen in the four to five percent range for nearly two years now.
New home sales declined six percent month-over-month to a seasonally adjusted annual rate of 551,000 units in May. April’s 586,000 units were the highest since February 2008.
Wednesday brings durable goods orders (June, advance) and the pending home sales index (June).
Orders for non-defense capital goods ex-aircraft dropped 3.8 percent y/y in May to a seasonally adjusted annual rate of $62.3 billion. This was the 7th consecutive y/y drop, and 16th in the last 17 months. Orders peaked in September 2014 at $70.7 billion.
Pending home sales dropped 3.7 percent m/m in May to 110.8. April’s 115 was the highest since March 2006. This metric correlates well with existing home sales.
On Friday, we get GDP (2Q16, advance), ECI (2Q06), and the University of Michigan’s consumer sentiment (July, final).
Real GDP grew 1.1 percent in 1Q16. Growth has been sub-par, with the average since 3Q09 of 2.1 percent versus 3.2 percent going back to 2Q47.
Private-sector compensation has struggled to grow, with 1Q16 growth of 1.8 percent y/y. Total comp also increased at less than two percent in the prior three quarters. Wages & salaries did a little better, growing at two percent in 1Q16, and benefits 1.2 percent.
Consumer sentiment fell four points m/m to 89.5 in July. The cycle high of 98.1 was reached in January last year – an 11-year high.
Thanks for reading.
Twitter: @hedgopia
Author may hold a position in mentioned securities at the time of publication. Any opinions expressed herein are solely those of the author, and do not in any way represent the views or opinions of any other person or entity.
")


