Johnson Controls (JCI) made it on my radar screens a few months ago as a proxy play on what I foresee as a Commercial Real Estate frenzy that will play out over the next few years. The trigger to get long was some large option trades, which have resulted in total calls Open Interest to almost double vs. the 20 day average, and still show almost 15,000 contracts in OI for the July 55 calls (out of a total of about 52,000).
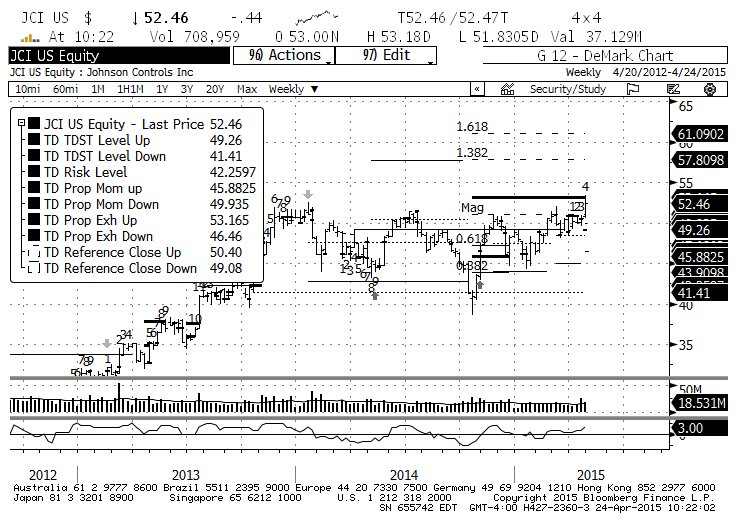
Looking at the stock chart from a DeMark indicators point of view proves equally bullish. On a daily basis the stock tagged the secondary buy exhaustion level (i.e. “Risk Level”) at $53.19, and it will end the week on bar 7 of a Sell Setup. So the next couple of weeks should see some consolidation.
But on a weekly basis, the fun looks to be just beginning. The price broke TDST Level Up on a qualified basis while the Sell Setup count is only on bar 4. This means that we should expect completion of the Sell Setup and of the ensuing Sequential Countdown 13. Meanwhile, TD Relative Retracement off of the October 2014 spike low projects first to $57.80 and then to $61.09.
This is a fundamental story, supported by large flows into out of the money call options, and technicals that suggest those spec calls may end up being nicely profitable. The weekly DeMark stock chart is below.
Johnson Controls (JCI) Stock Chart
Follow Fil on Twitter: @FZucchi
The author is long JCI at the time of publication. Any opinions expressed herein are solely those of the author, and do not in any way represent the views or opinions of any other person or entity.


