 If there’s any trade that has been more persuasive and irrepressible in 2013 than Developed Market equities, it’s the short Japanese Yen (JPY) trade. Just like the S&P 500 (SPX), JPY hasn’t been so persistently one-sided since 1995.
Back then – and again in the mid-2000s – the short JPY bias was fueled by the pervasively-adopted Yen carry trade, induced by the wide disparity between a rock-bottom Bank of Japan-maintained overnight rate (0.5% throughout much of this period) and the borrowing rates maintained by other G10 Central Banks like the US Federal Reserve.
In the race-to-the-bottom, ZIRP and Currency War-obsessed world of today, that (DM, at least) carry trade is all-but dead – a bygone relic of a time before the Age of Accommodation. This time around, the JPY’s aggressive debasement is a function of Abenomics and the BOJ’s sustained punishment of “unprecedented stimulus” via its own serially-increased QE program.
Whatever the instigating policy or party, JPY has been torched ever since the accession of Prime Minister Shinzo Abe and the aggressive monetary easing central to his platform became the de facto outcome of late 2012’s Japanese elections. The result: year-over-year, the Japanese Yen futures (J6) are down -21%.
So, the move against the JPY has been an unmitigated rout. Looking further into the past, however, reveals now is a very good time to assess and reassess the sustainability of the current trend on a forward-looking basis.
To begin: the Yen is pushing into major horizontal support last seen at the peaks tagged in 2000, 2005, and 2008. At the same time JPY is testing secular rising trend line support off its mid-1980’s low for the first time in 5 years. This intersection of time and price are well-delineated by the field of long-term fibonacci cluster support grouped between 0.92 and 1, denoted by the blue horizontal lines below:
Japanese Yen (JPY) – Monthly – Secular Rising Trend Line Support (click image to zoom)
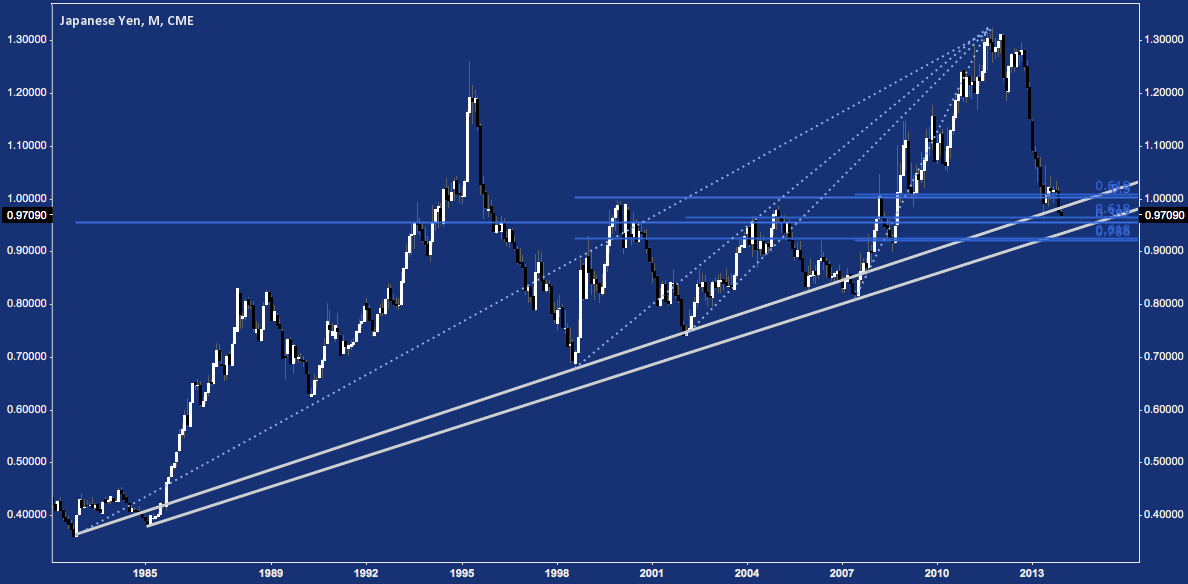
This line has seen three brief tests: 1) Summer 1998 (post-LTCM); 2) Winter 2002 (post-Dot-Com); and 3) Summer 2007 (pre-Great Recession). Each held and produced major 20%+ secular trend-affirming rallies. Perhaps this time is different for the Japanese Yen. Some may argue as much given the BoJ’s monetary accommodation; but then, a little history reveals Japan is no stranger to QE over the last several decades.
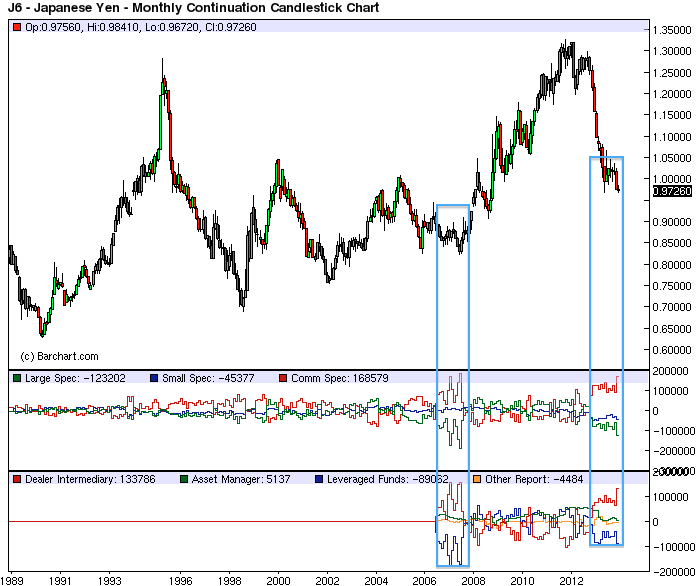
Here’s a compelling reason it’s (probably) not different, Abenomics or not. Below is another chart of JPY futures (J6) stretching back to the late 1980s. In the middle panel lies the CFTC’s Commitment of Traders data (Unfamiliar? Check out Alex Bernal’s great explanation of how to read/use the COT here).
Here, the aggregated CoT data shows “Comm Spec” or Commercial Speculators (those entities whose primary function in the marketplace is to build and manage hedges) at their highest long exposure since mid-2007. In fact, Comm Specs have been more net-long than 12/03/2013’s 168.5k reading only once: June 2007’s 186.5k.
Comm Specs build long positions as a market declines; then unwinding and flipping those positions short as the market reverses. In contrast, “Large Spec” or Large Speculators generally take the other side of the trade, following trends as the develop. Little surprise, then, that Large Specs are as heavily short as they’ve been since late 2007, just prior to the massive carry trade unwind (which saw huge short-JPY covering) in 2008.
CoT extremes are imprecise: major market contingents – those who hedge v. those who are directional speculators – can become more polarized to an indeterminate point. But with Comm Specs and Large Specs committed at near-historic levels, their extreme sentiment is much closer to the rubberband-snap of mean reversion than a simple look at price may suggest.
Japanese Yen Futures (J6) – Monthly – Commitment of Traders at Historic Extremes (click image to zoom)
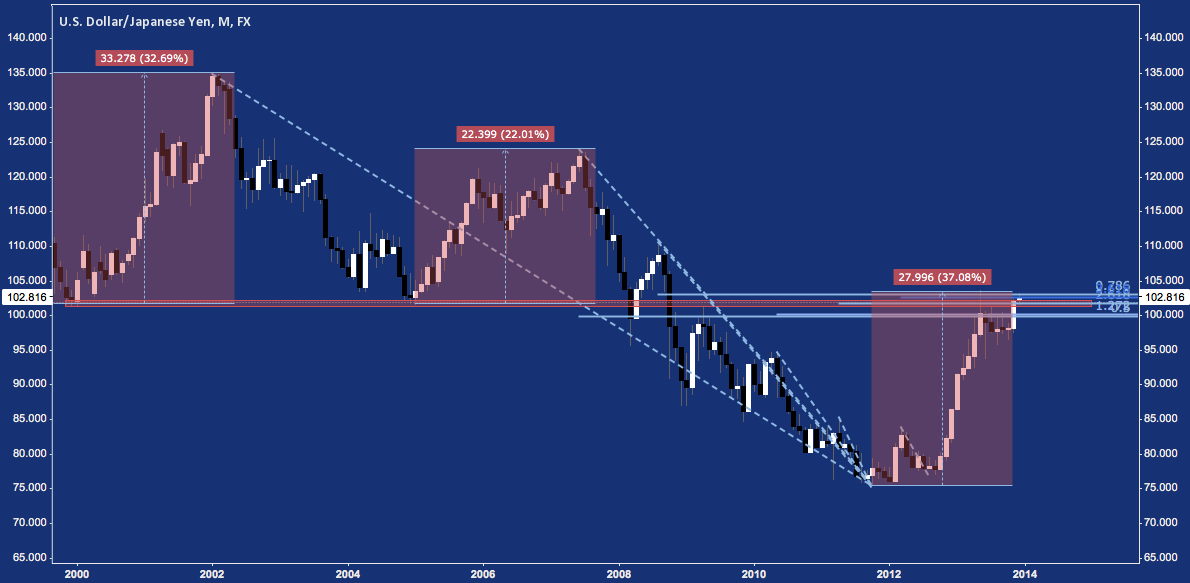
Almost a mirror image of the J6 contract above, the US Dollar/Japanese Yen (USD/JPY) pair is up against at major resistance between 102-105 amidsti major cluster resistance:
US Dollar/Japanese Yen (USD/JPY) – Monthly: Resistance at 102-105 (click image to zoom)
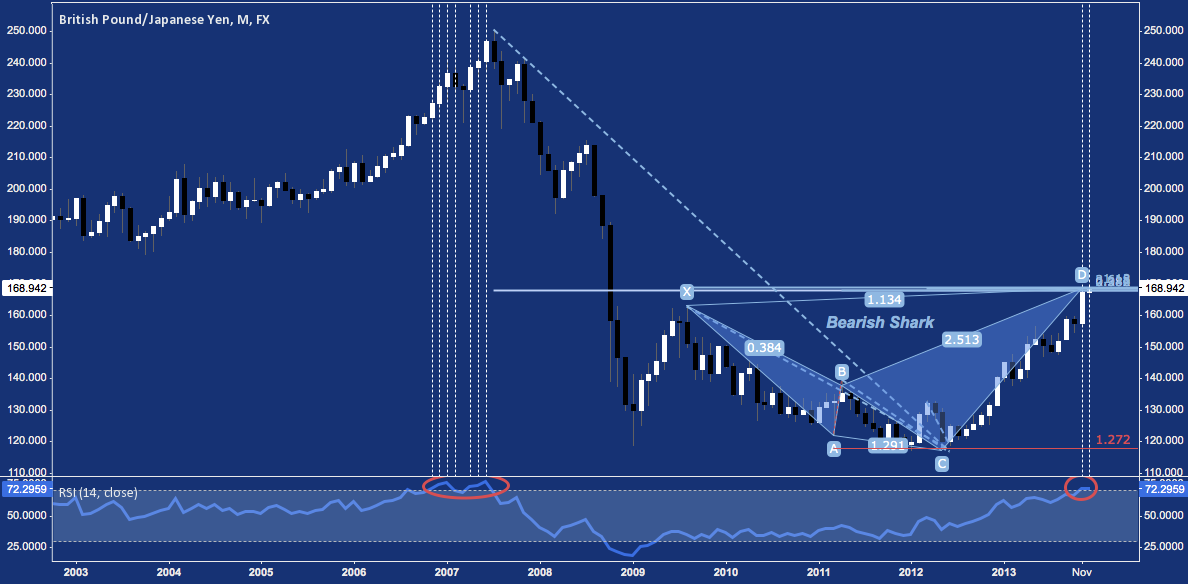
The British Pound/Japanese Yen (GBP/JPY) – probably the most spectacular short of the JPY crosses in 2008 – is similarly at a multi-year Bearish Shark potential reversal zone near 170, just as its monthly RSi peaks into over-bought territory as it did in early-mid 2007.
British Pound, Japanese Yen (GBP/JPY) – Monthly: Resistance at 170 (click image to zoom)
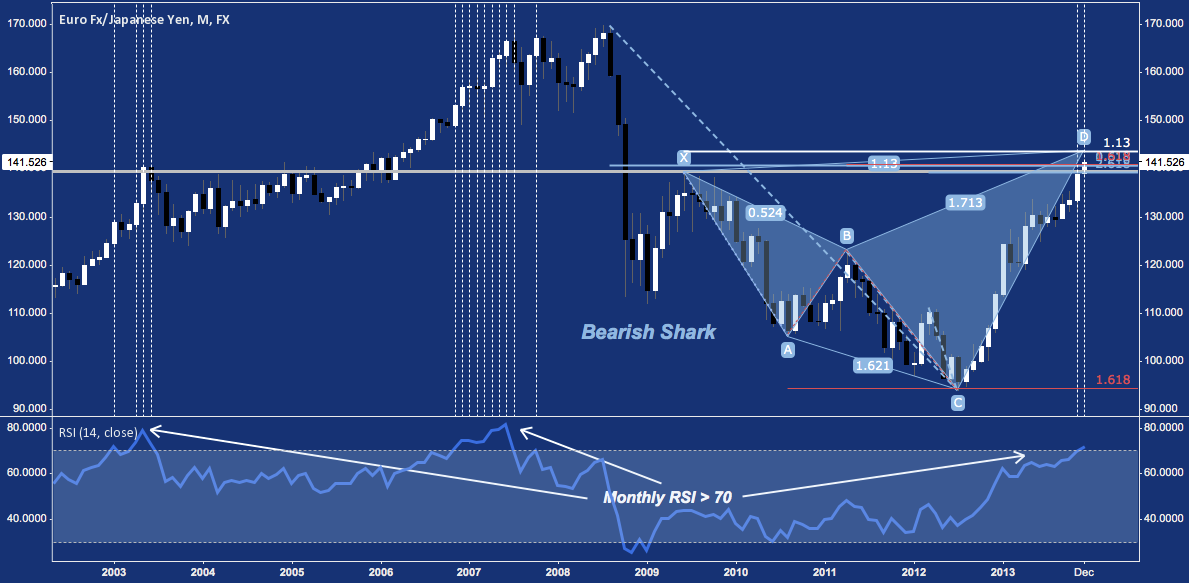
The most closely-watched Yen Cross pair is undoubtedly the Euro/Japanese Yen (EUR/JPY), as much for its base currency as its exceptionally tight positive correlation to stocks. EUR/JPY is likewise at Bearish Shark resistance around 143 and tripping a monthly RSI >70 for the second month in a row:
Euro/Japanese Yen (EUR/JPY) – Monthly: Resistance Near 143 (click image to zoom)
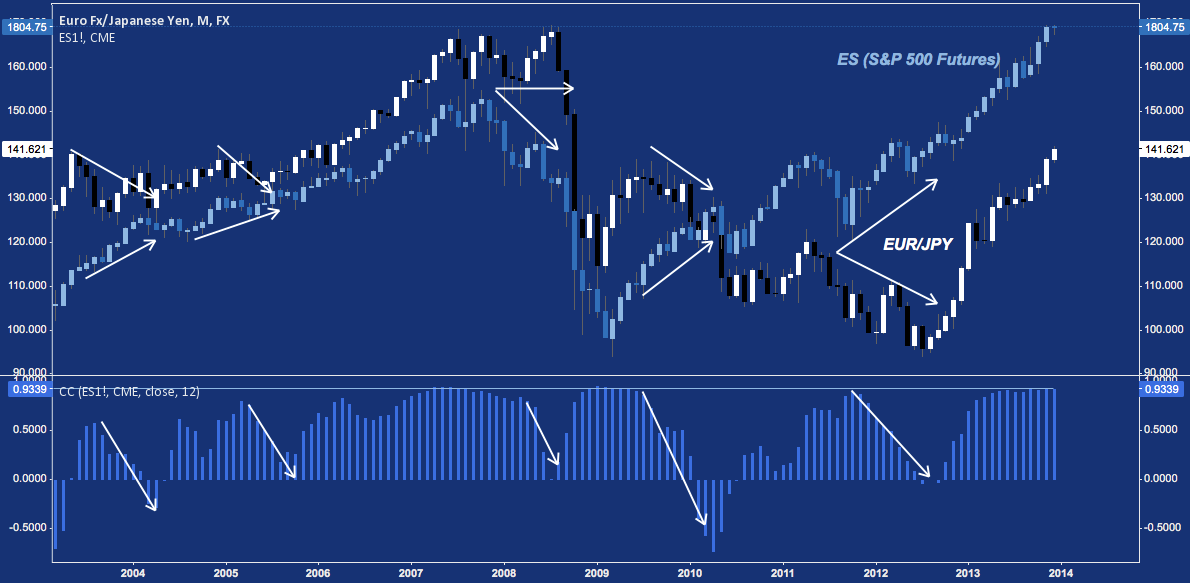
Speaking of that positive correlation, EUR/JPY and the S&P 500 (ES), at a -.934 TTM coefficient coming off EUR/JPY’s July 2012 bottom at 94 they are currently as tightly wound-together over a sustained period as they get. There are several scenarios that may unfold from here; but they give scant hope to the short-Yen thesis.
Euro/Japanese Yen (EUR/JPY) & S&P 500 (ES) – Monthly: L/T Positive Correlation at Its Extreme
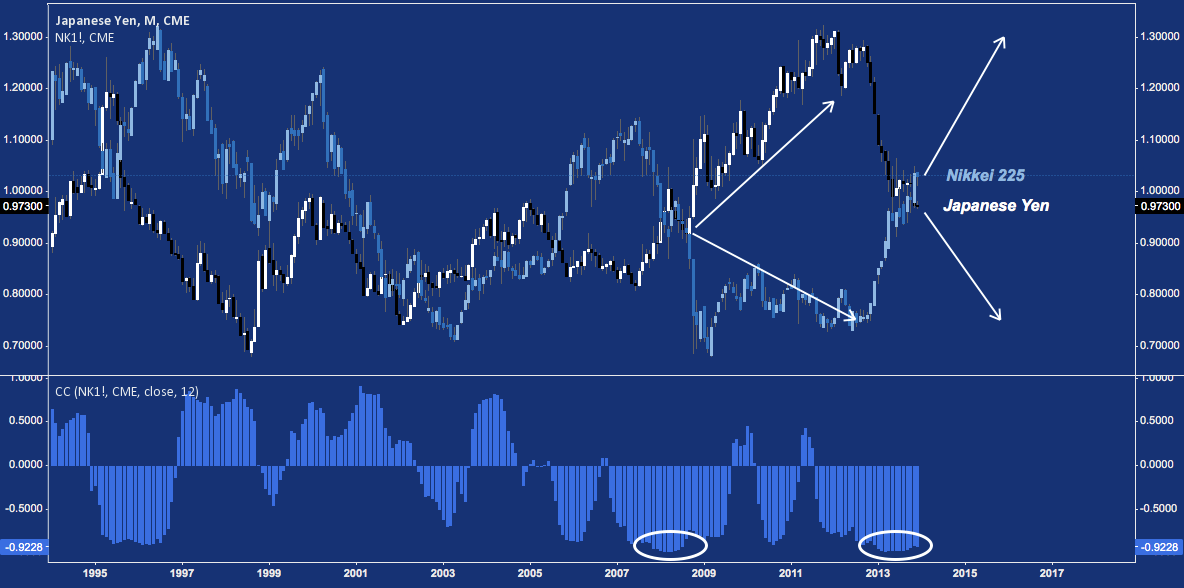
Turning this relationship inside out, here’s the Yen (J6) and the Nikkei 225 (NKD), currently at a -0.925 correlation. The late 1990’s paint one picture: then, JPY declined as the Nikkei rocketed higher, driving their correlation into the ground. That worked until late 1996 when the Nikkei linked back up and the correlation did a complete one-eighty. 2007-2009 paints another: the JPY decline and corresponding NKD ramp abruptly reversed, with the carry unwind driving JPY higher in one of its biggest bull runs ever (there’s always one somewhere). Needless to say, this wasn’t a beneficial environment for the Nikkei then (the same could be said about now) or the S&P 500.
Japanese Yen (J6) & Nikkei 225 (NKD) – Monthly: L/T Negative Correlation at Its Extreme
With JPY positioning and FX/equity correlations at such extremes, the monetary shock-and-awe of Abenomics more-or-less spent, major multi-year bearish harmonic patterns at reversal zones and equities at multi-year (or all-time) highs, major moves in the Yen, Nikkei and the general risk-on trade probably aren’t long in coming.
Twitter: @andrewunknown and @seeitmarket
Author holds no exposure to securities mentioned at the time of publication.
Any opinions expressed herein are solely those of the author, and do not in any way represent the views or opinions of any other person or entity.


 Rolling Over At Key Fibonacci Level?")

