While we believe the US Dollar Index (DXY) is destined to climb higher during the next few years, it appears still to be working through a corrective pattern on monthly and weekly charts. This suggests that a modest “base hits” trading approach could produce near-term gains with the index and the related US Dollar ETF – the Power Shares DB U.S. Dollar Bullish ETF (UUP).
In this post, we will highlight where the US Dollar may be headed and why the “base hits” approach is ideal for currency (and ETF) traders.
With both the Dollar index and the Dollar ETF, prices have declined from their early 2015 highs into support areas. However, based on a close examination of the declining wave structure in the US Dollar Index (not shown), it appears likely that the correction will last several more months, producing additional upward and downward swings.
The decline we have already seen this year probably represents the first wave of what will become a more complex corrective pattern, as we have sketched on the weekly US Dollar ETF (UUP) chart below.
Bullish US Dollar ETF (UUP) Chart – A Near-Term Trade?
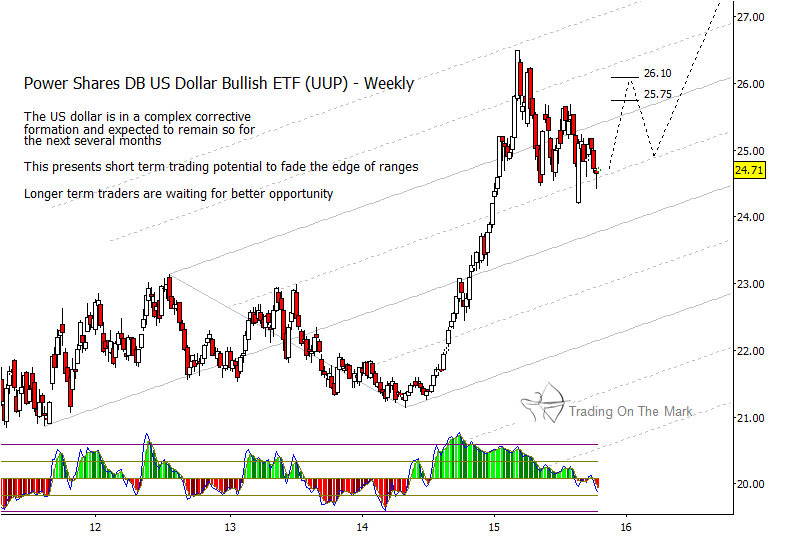
Longer-term bullish traders might consider waiting until the correction has played out before taking positions – an opportunity which could come during spring 2016. On the other hand, traders working with weekly and daily charts might watch the present area for support, with the expectation of a relatively quick bounce higher into areas near one of the targets shown on the US Dollar ETF chart, around $25.75 and $26.10.
If the Dollar ETF rallies as expected, it will be important for traders to monitor the charts for signs of exhaustion as price approaches the higher target areas. As always, the targets represent estimates of where the actual price might go. For readers who might have a great deal of experience with investing, but for whom the “trading mindset” is relatively new, we recommend studying the uses of common momentum indicators such as the Relative Strength Index (RSI) and the moving average convergence/divergence indicator (MACD) and watching for the divergence and crossover formations that commonly appear on those indicators when a price move is nearing its end.
Related to this, readers can find bigger-picture road maps and forecasts for the US Dollar Index and for gold prices in our most recent public post on our website. We are also planning to present another chart here at See It Market this weekend for a similar “base hit” approach with the Australian Dollar ETF (FXA). Stay tuned!
Twitter: @TradingOnMark
No position in any of the mentioned securities at the time of publication. Any opinions expressed herein are solely those of the author, and do not in any way represent the views or opinions of any other person or entity.

 Rolling Over At Key Fibonacci Level?")


