Back in May of 2015, I wrote a piece on the Russell 2000 Index highlighting 2 critical price support levels of 1221.44 and 1213.55. In that post, I also included a warning:
“Investors will look for price to build upon its recent rally. However, it should be noted that a pullback that pushes below the identified support levels would be reason for caution.”
It’s been a rough go of it for the Russell 2000 lately. The stock market is off to its worst start ever after one week, and the decline has put a Russell 2000 bear market into view.
But before we get ahead of ourselves, let’s review a chart from my post last spring.
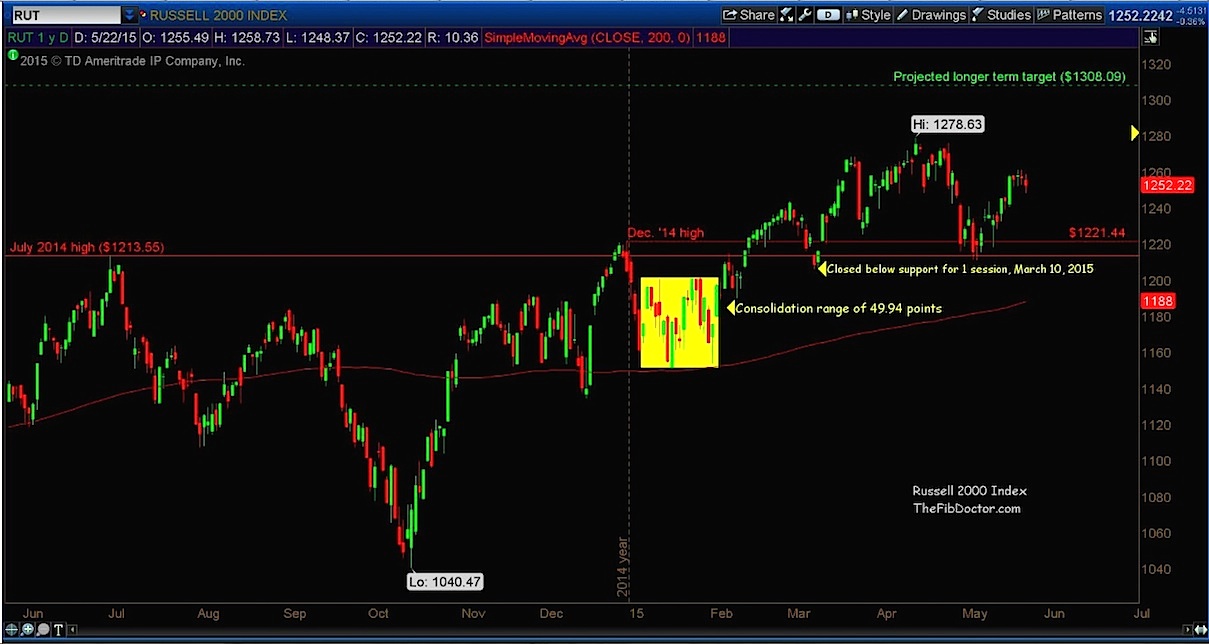
At the time, I highlighted a consolidation range that had lasted through the month of January 2015 which had produced a long term projected price target of 1308.09.
The original chart is posted below for reference.
Russell 2000 Index – 1 Year, Daily Chart
So, in the past 8 months, what has the Russell done?
Basically everything I’d expected: All price targets were hit in 2014 & 2015, with the exception of the last upside price target of 1308.09. The Russell made a high of 1296 on June 23rd, 2015. That high fell short of my price target by 0.9242%.
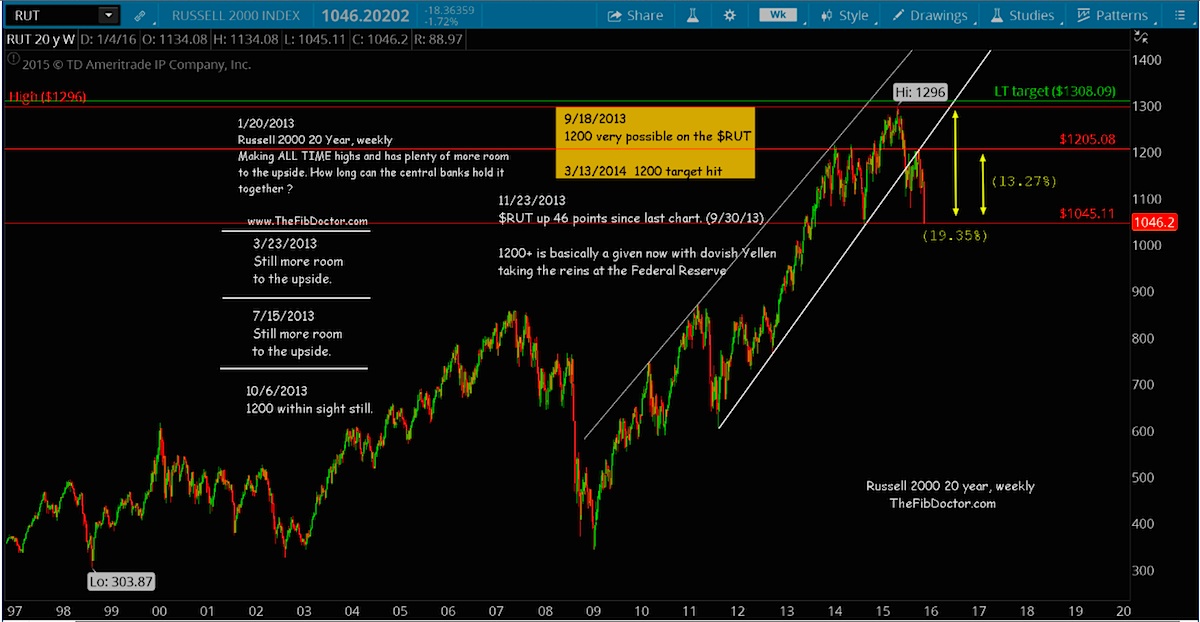
Now, let’s look at some charts and see where we are. We’ll start with a 20 year, weekly chart that I’ve been following for several years now. You’ll see that price declined out of the uptrend channel the week of August 17th, 2015 and could only briefly poke it’s head back inside the channel the week of September 14th, 2015.
The lower side of the uptrend channel has now become a resistance level with the last rejection coming in the week of November 30th, 2015. Price is currently down (13.27%) off that trend line. From the high of 1296 to the low that was made the week of January 4th is a correction of (19.35%), a whisper away from what could be the beginning of a technical Russell 2000 bear market.
Russell 2000 Index – 20 Year, Weekly Chart
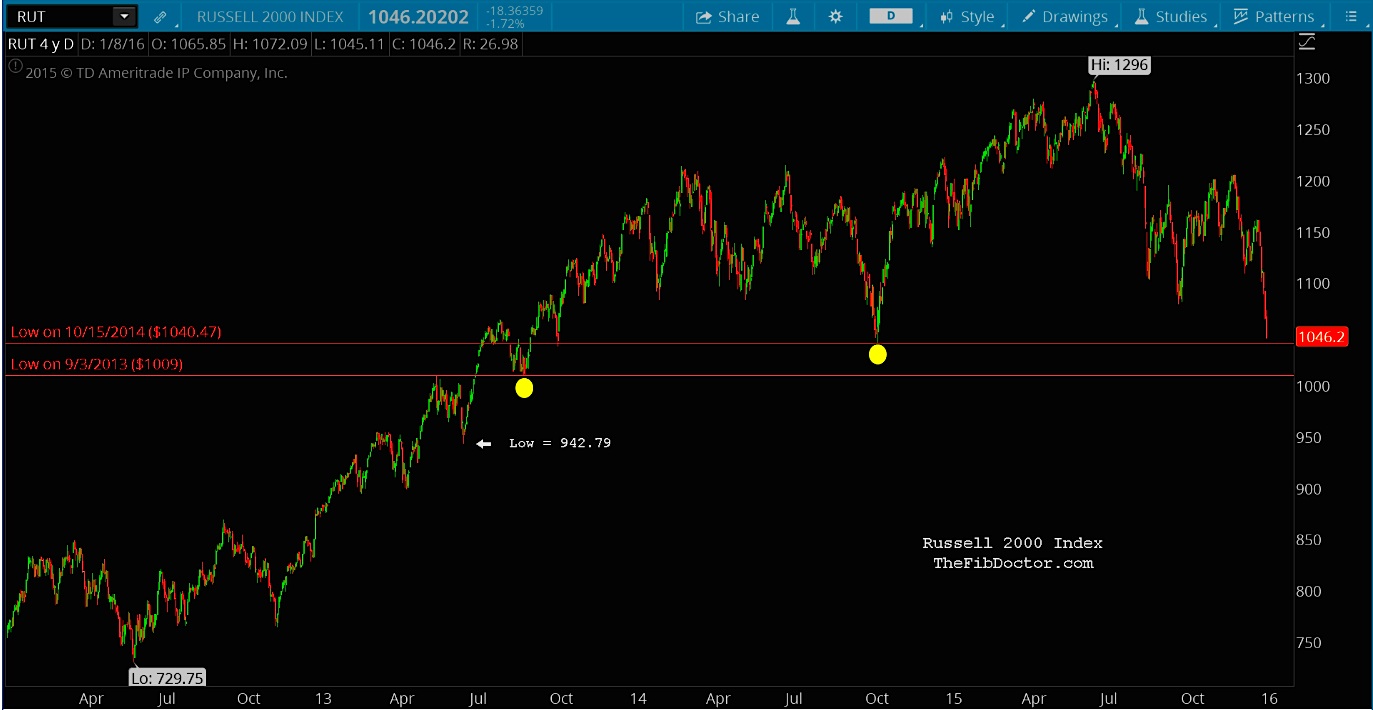
Now let’s drill down to a shorter time frame and look for clues as to where price may be headed. In the 4 year, daily chart below I’ve highlighted two levels of support that need to hold, 1040.47 and 1009. If both these levels fail to hold, the RUT would be technically very damaged. The next major lower support level is 942.79.
Russell 2000 Index – 4 Year, Daily Chart
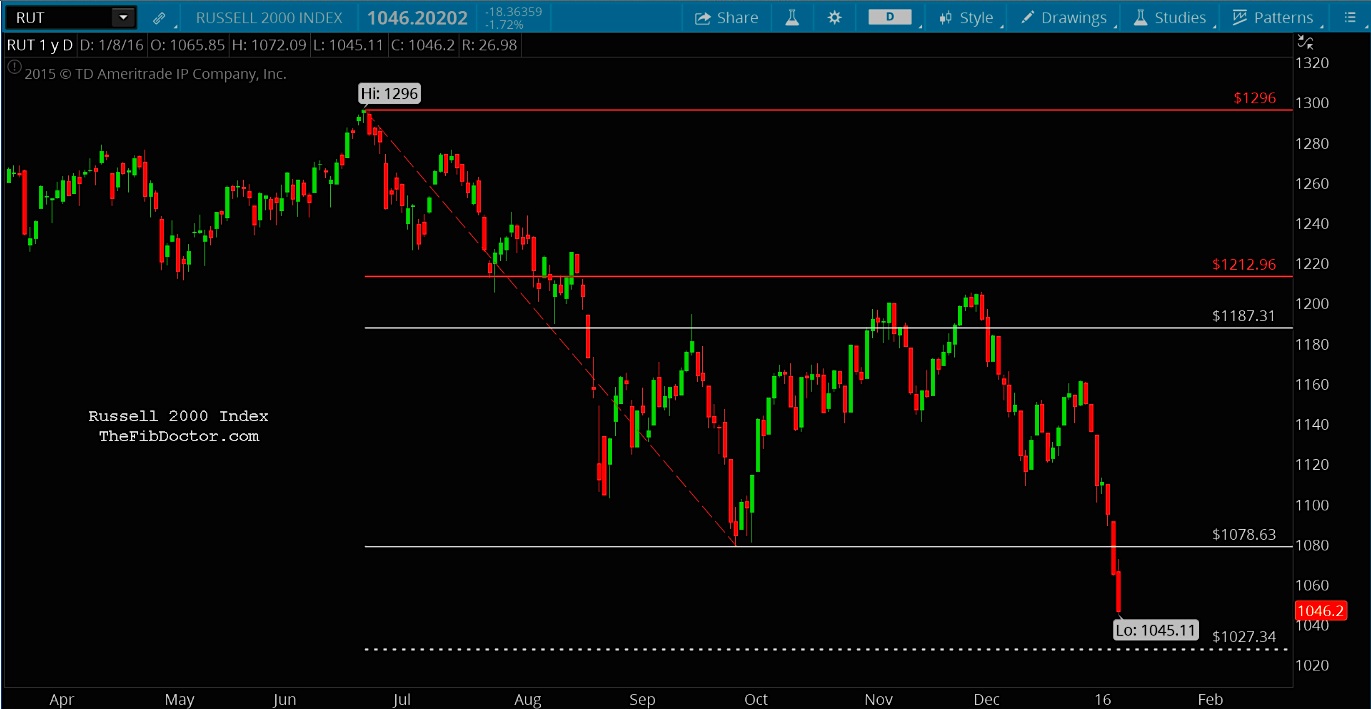
And lastly, using my Fibonacci method, the 1 year, daily chart below gives us a price target of 1027.34 with 2 resistance levels at 1187.31 and 1212.96. Considering this is a fairly long Fibonacci draw, you will want to draw tighter Fibonacci levels to find shorter term targets, support and resistance.
I’ll update this post as warranted.
Russell 2000 Index – 1 Year, Daily Chart
So there’s a high likelihood that we see a technical Russell 2000 bear market. But the length of that bear market is yet to be determined. Thanks for reading and always use a stop loss!
Twitter: @TheFibDoctor
No position in any of the mentioned securities at the time of publication. Any opinions expressed herein are solely those of the author, and do not in any way represent the views or opinions of any other person or entity.


