Folks, going to point you to a post that my “boy” (he says that a lot, not sure why – must be a Cuban thing?) wrote about the YEN and it’s importance to the US Equity Market. Click here to read the post – it’s by JC Parets. If your not one of the 50K following him on StockTwits you should.
When I was an instructor for the CMT III course we would have a bunch of people go online from all over the world – it was cool. As the market was cracking in 2007-2008 I would play Led Zeppelin “when the levy breaks” before each class. There was one dude who would be all out of breath and I would ask – what the hell are you doing man? The reply – “going for a run in central park listening to an audio book on technical analysis and CMT III”… that’s JC. Enough said.
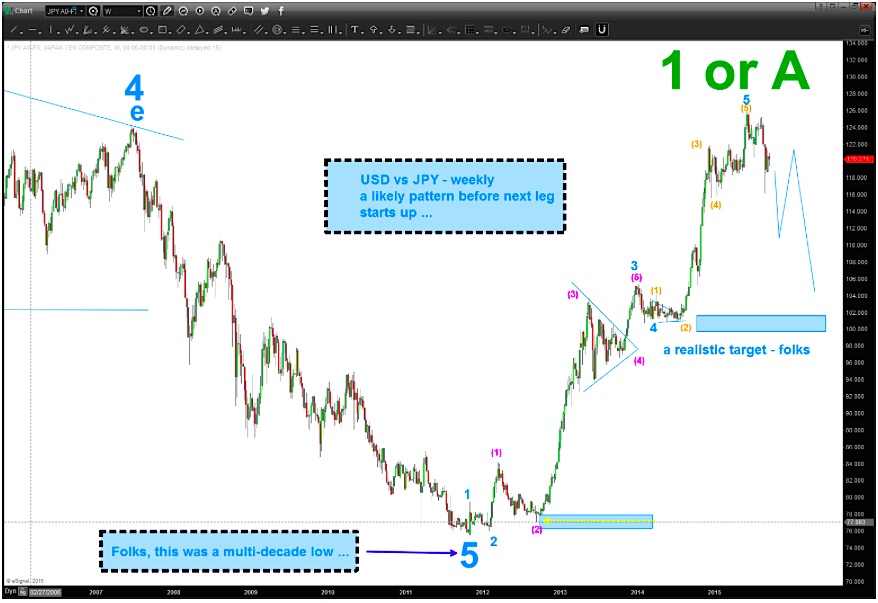
After you digest his blog post, take a look at the following two charts. My thesis – we have completed a pretty big high on the USDJPY (US Dollar to Japanese Yen). Do a search for the term “YEN” on my site and you’ll see I’ve been following this count pretty well. Why is that important? Well, because it’s time for true confessions…
See the little yellow arrow on the first chart below? (boxed in with blue background)
I got stopped out at that level trying to go long the USDJPY. I GOT STOPPED OUT BY 7 PIPS! That put me into my first ever drawdown in 10 years and, well, welcome to a trader meets kryptonite…
Needless to say, I’m interested in the USDJPY.
So, to the charts we go. Folks, I like this count. I don’t see it going much higher. According to the rules I taught in CMT III the previous wave 4 of a lesser degree is a target. Um, that’s around 100. In currency terms that is huge. (Kind of like the quadrillion of derivatives outstanding).
So, if we’re correct here and the correlation with stocks remains intact, then equities are about to have a tough time.
USDJPY – Macro Long-Term View
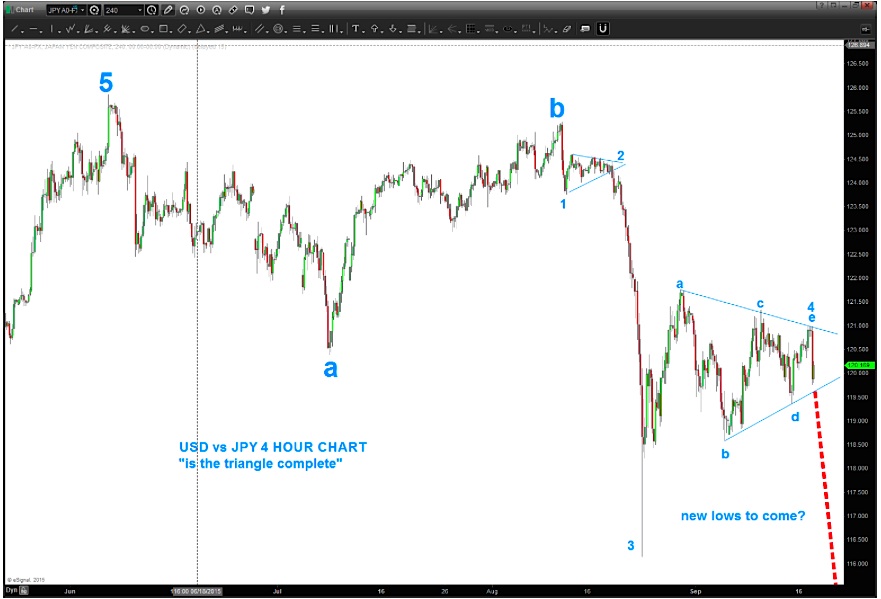
You can see (chart below) that I am labeling it A-B-C (we just finished triangle 4 with a 5th wave to come) for now because the uptrend is so powerful… the probability is that we will see a new low below 116 on the USDJPY. At that time, we’ll take a look at labeling this A with B-C to come or correction complete. For now, if we break that lower trend line below, consider another move lower and therefore weakness in stocks over the coming weeks.
USDJPY – ZOOM Short-Term View
Thanks for reading.
Twitter: @BartsCharts
Author does not have a position in mentioned securities at the time of publication. Any opinions expressed herein are solely those of the author, and do not in any way represent the views or opinions of any other person or entity.


 Ready To Break Out?")


