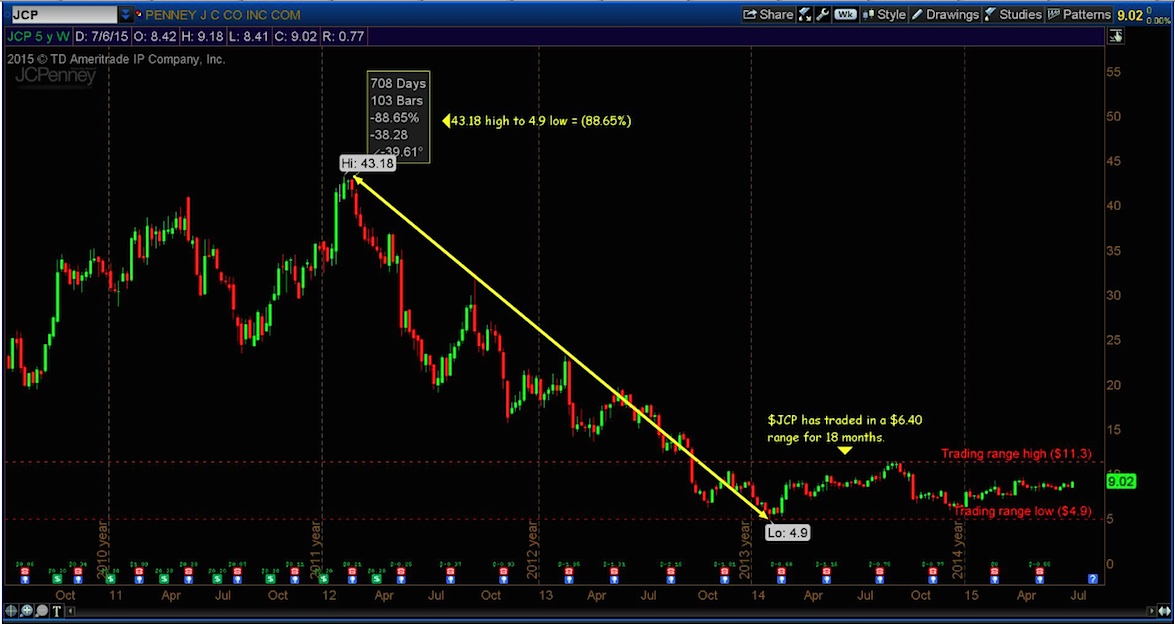
JC Penney Co. Inc. (JCP) has taken a beating since Q1 2012. From that time until Q1 2014, JC Penney stock lost (88.65%) of it’s value. Since making a weekly low of $4.90, JCP has trade in a range of $6.40 for the last 18 months. In sum, investors have seen a major move down followed by an 18 month consolidation. This could very well be a base being built for a move higher.
So how could active investors play this ? Let’s look at at some Fibonacci levels for clues. We’ll start with a 5 year chart of JC Penney stock and then narrow our focus to a 1 year chart.
In the 5 year chart below, you can see the big move lower and the consolidation range that I talked about. (click charts to enlarge)
JC Penney Stock (JCP) – 5 Year Weekly Chart
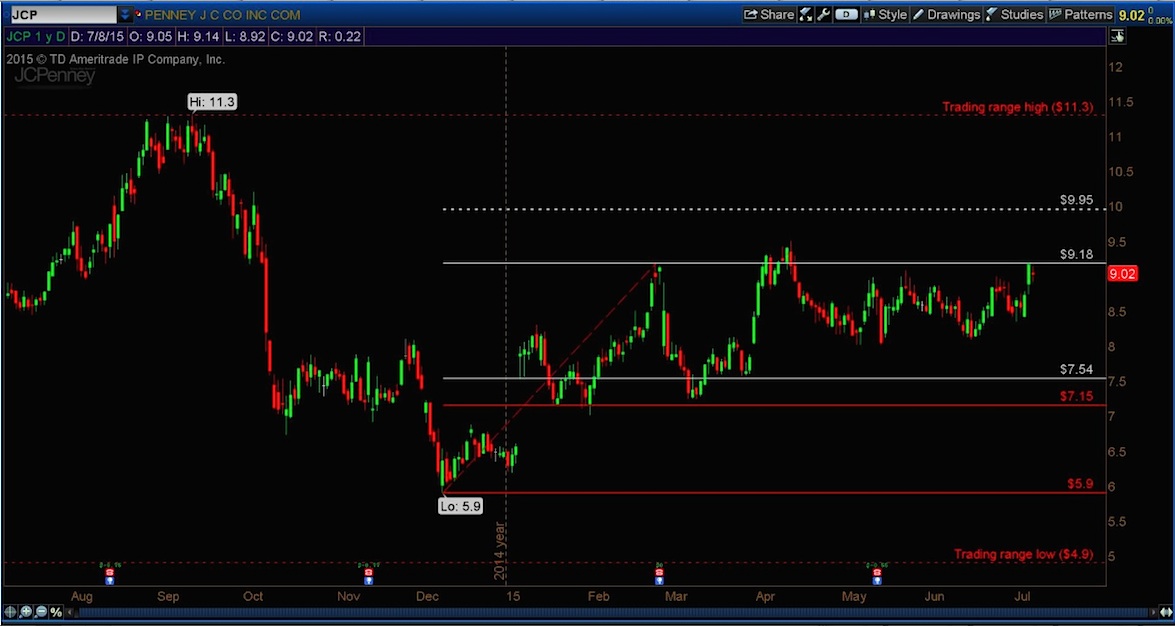
Now, let’s zoom in and take a look at some levels to watch for. In the 1 year chart below, I have an upside price target of $9.95. A close above that level would make for a good partial position entry point in my opinion. The next level you want to clear is $11.30; the high of the trading range. A close above there would be evidence of a probable continuation to the upside.
When, and if, JC Penney stock price closes above the daily price target of $9.95, new Fibonacci levels would need to be drawn to ascertain a new target.
JC Penney Stock (JCP) – 1 Year Daily Chart
Thanks for reading and always use a stop!
Twitter: @TheFibDoctor
No position in any of the mentioned securities at the time of publication. Any opinions expressed herein are solely those of the author, and do not in any way represent the views or opinions of any other person or entity.

 Rolling Over At Key Fibonacci Level?")


