Did the Dow Jones Industrial Average (DJIA) create a “Doji Star” topping pattern last month? Possible! Doji Star patterns (which look like a + sign on a chart) can take place at key reversal points (i.e. highs & lows).
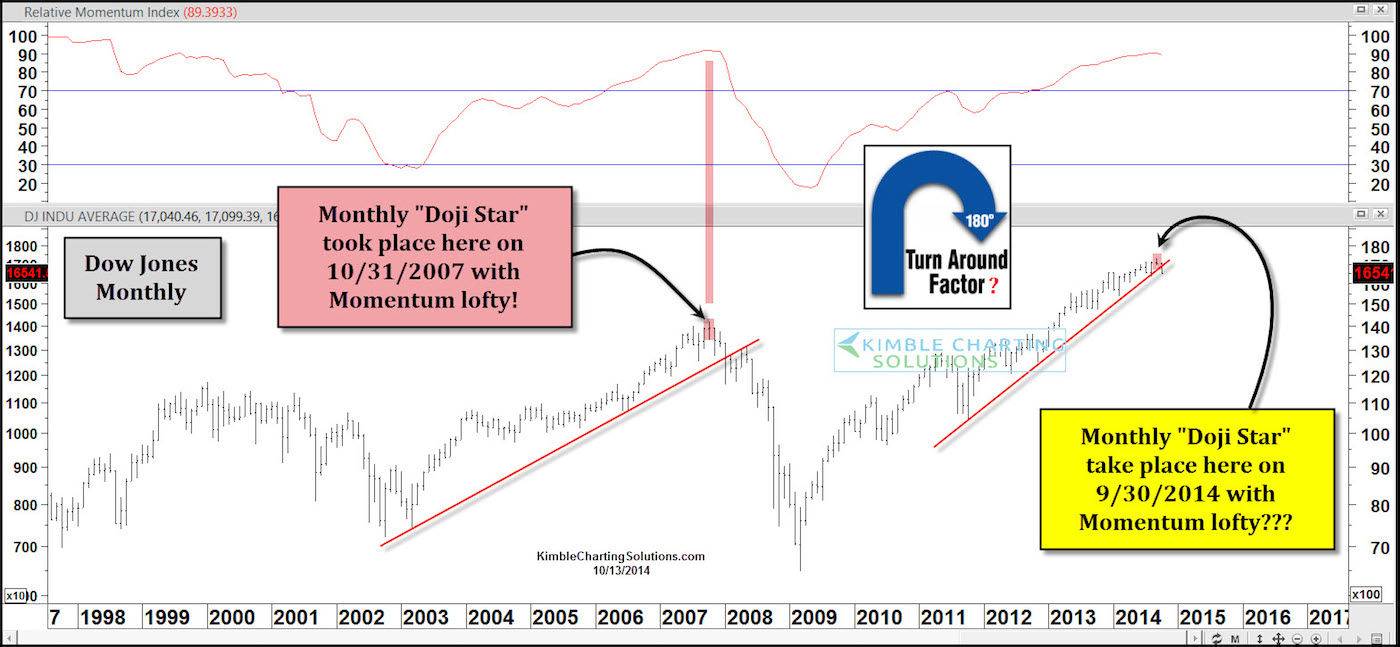
The chart below highlights that a Monthly Dow Jones Doji Star took place in October of 2007, which ended up marking the high that year. Did the Dow Jones create a similar monthly Doji Star topping pattern last month? It will take some time to prove this pattern out, since this is a monthly chart, but either way it seems to have been a caution sign.
Dow Jones Industrial Average – Monthly Doji Star Candles 2007 & 2014
If this pattern read is correct, it could become a very important high in the market! This may depend largely on whether we see follow through selling over the coming weeks. What do you think? Are you concerned by the recent setup? Thanks for reading!
Read more from Chris on his Blog. Follow Chris on Twitter: @KimbleCharting
No position in any of the mentioned securities at the time of publication. Any opinions expressed herein are solely those of the author, and do not in any way represent the views or opinions of any other person or entity.


