 There’s been a very interesting development in the Investors Intelligence US Advisors’ Sentiment Report this week, as more than 40% of those polled are looking for a correction. This is just the fourth time that has happened since 1983, so you know it sparked my attention.
First things first, this sentiment poll is affectionately known in the industry as the II poll. The II stands for Investors Intelligence. You can read more about the Investors Intelligence poll here, but it is a survey of over a hundred market newsletters and they assess each author’s current stance on the market: bullish, bearish or correction. This poll is usually used as a contrarian indicator – when everyone is bullish, who is left to buy? Or if everyone is bearish, who is left to sell?
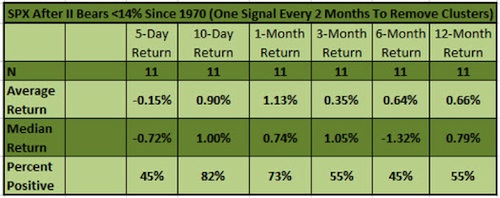
Last month, the bears in this poll hit their lowest since 1987. That headline got a lot of press, so I looked into it over at Yahoo Finance. I did find the returns after are rather weak going out: A year later the S&P 500 (SPX) is virtually flat, versus the average year of up about +9% since 1950. Now this doesn’t mean that we have to crash, but it was a warning.
Let’s now dig in on the crowd looking for a correction. Below shows you just how rare a 40% correction reading is, as from the early 1980s until just recently we went nearly 25 years without an Investors Intelligence reading this high.
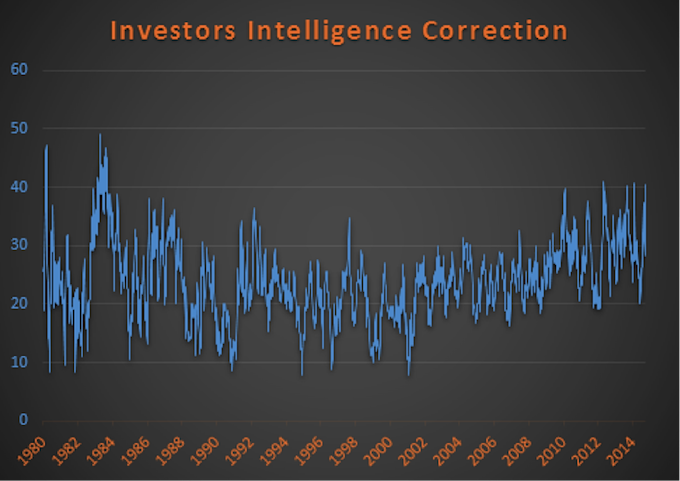
Why are we seeing so many in the correction camp, versus just saying they are bearish? My take here is so many bears have been embarrassed for years now, no one wants to put on the full bear custom – as that usually means we rally.
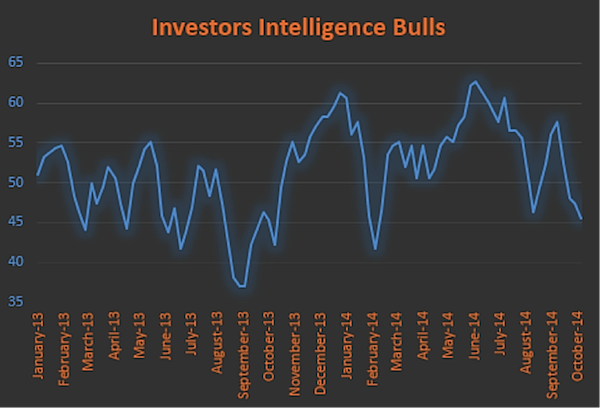
Here’s what the bears look like, still near the lower end of the recent years.
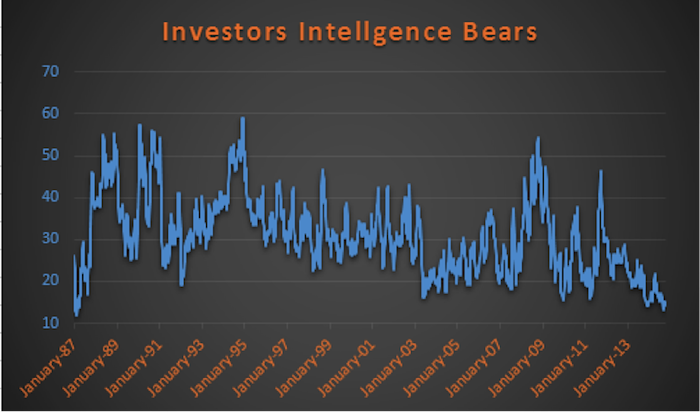
The bulls are the ones that are dropping, so we have some bulls moving into the correction camp I’d say.
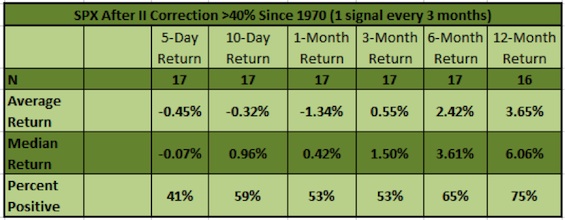
Since 1970, there have been 74 times correction got up over 40%. As we usually see, these tend to happen in clusters. Taking just one signal every three months (to remove clusters), the S&P 500 returns out a year are rather weak.
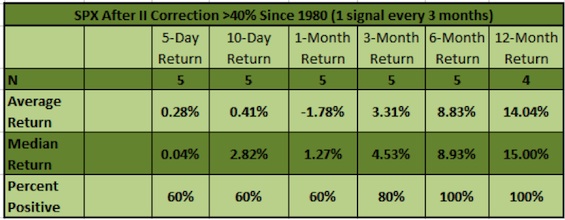
Most of these signals did occur during the 1970s, so if we start in 1980 the results are much better… especially as you go further out in time.
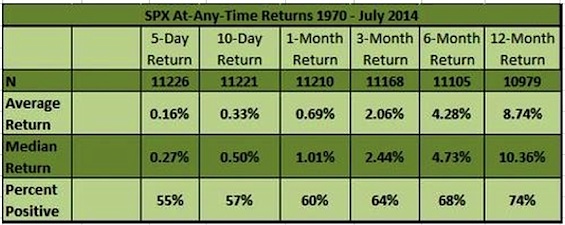
Here are the average returns on the S&P 500 to get a comparison on things.
I do view this as encouraging. We are seeing many sentiment indicators getting up near previous times of major stock market lows and the masses looking for a correction could add to this list. Still, seasonality the next few weeks is dicey and these two charts are my biggest worries, but the number of potential positives is starting to build.
Follow Ryan on Twitter: @RyanDetrick
No position in any of the mentioned securities at the time of publication. Any opinions expressed herein are solely those of the author, and do not in any way represent the views or opinions of any other person or entity.
")


