 The U.S. equities market sputters along, and despite global uncertainty in Asia and now the crisis in the Ukraine, the trend is still up. Turning to Crude Oil, the market’s reliable truth serum, may offer us a better vantage point on the health of demand in the global economy. The weekly chart below of Light Sweet Crude Oil prices highlights Crude Oil’s ability to predict future market weakness.
Since the summer of 2010, Crude Oil prices have turned down ahead of the equities markets. This fall, oil price weakness pre-empted Mr. Market’s concerns with the consumer, and what the bulls may have anticipated to be a more productive season for retail turned to disappointment. While the relationship of Crude Oil prices and the S&P 500 is not in pure synchronicity, Crude Oil, a reliable indicator of demand, is worth watching over the coming days. Why? Because oil prices are nearing some important technical support lines. A break through or bounce off these lines will offer traders another perspective on the overall health of the economy.
Light Sweet Crude Oil Index – Weekly Chart
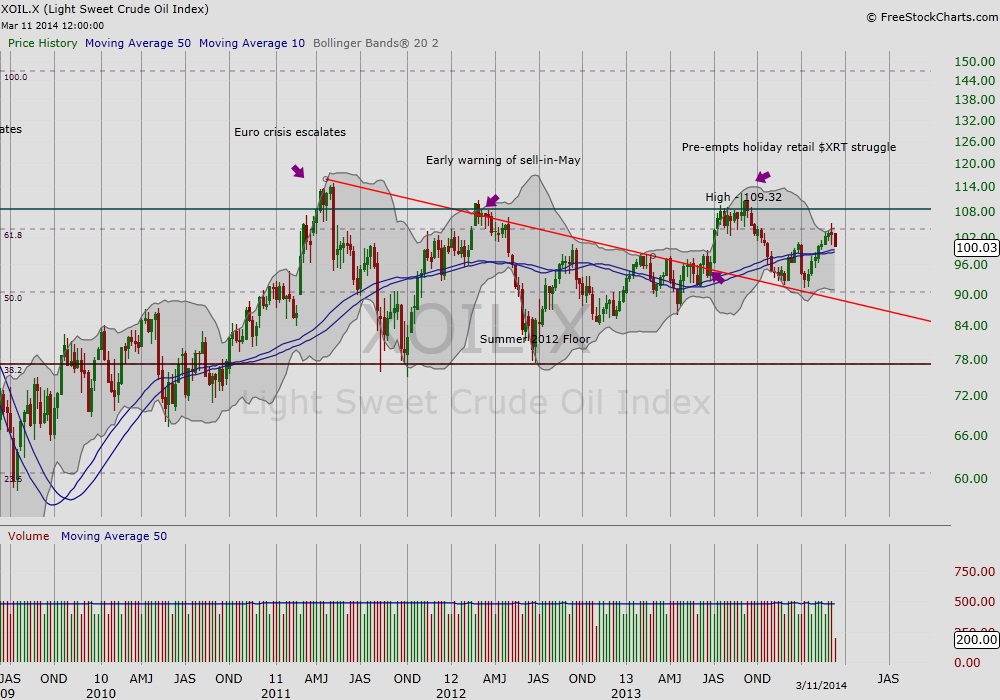
The weekly chart above shows Crude Oil is just above the 10/50 weekly moving averages. This pair is a natural support for long-term traders and investors.
As well, Trend lines across time tend to provide guidelines. In this light, we see the trend line in red has served as support in recent past. Below this is the brown trend line coming in around $78 that served as support during both the 2011 and 2012 summer lows.
Light Sweet Crude Oil Index – Daily Chart
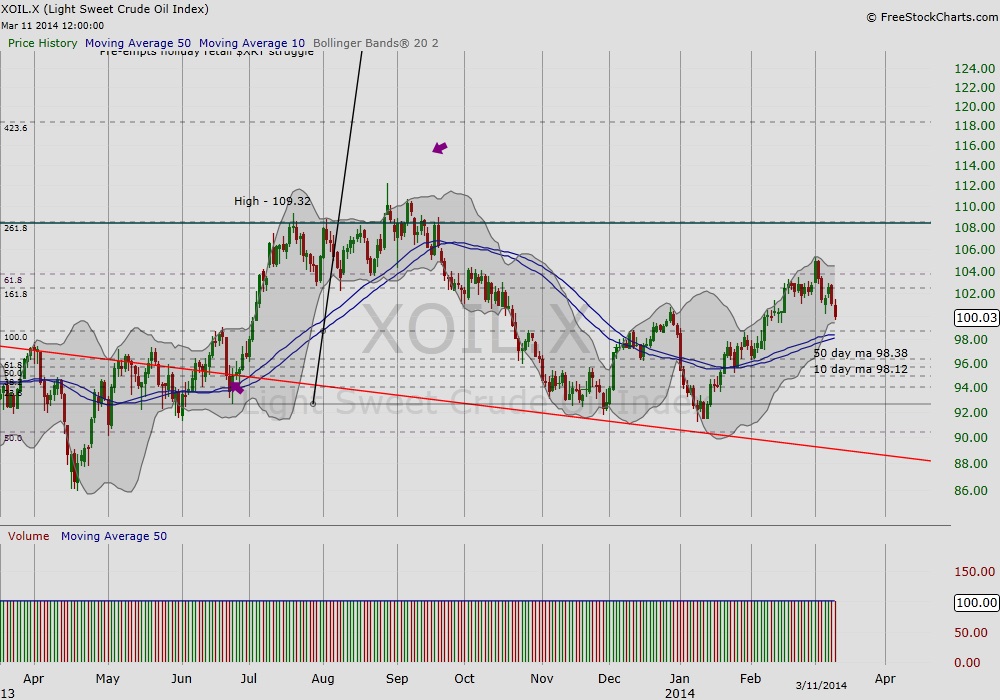
The daily chart above offers a bird’s eye view of support levels traders will be watching. A test at these levels will be a time to watch for confirmation for weakness or strength with equities. Thank you for reading.
Twitter: @RinehartMaria
Charts created with FreeStockCharts.
No position in any of the mentioned securities at the time of publication. Any opinions expressed herein are solely those of the author, and do not in any way represent the views or opinions of any other person or entity.

 Rolling Over At Key Fibonacci Level?")


 Rolling Over At Key Fibonacci Level?")