The biggest and most heavily-traded ETFs are often the ones that investors default to for stock exposure. The most obvious benefits are liquidity, low-cost, and flexibility to be either long or short the market in size.
For traders, the clear favorites are the SPDR S&P 500 ETF (NYSEARCA:SPY) and PowerShares QQQ (NASDAQ:QQQ). Both of these funds provide broad-based exposure to a wide range of stocks in a single investment vehicle. They are also two of the most heavily traded ETFs in the market on a daily basis. This makes them exceptional tools as either core holdings or tactical trading vehicles.
No matter how you may use these funds, it’s worth digging into their makeup and history to better understand their benefits and risks. Let’s dig into the performance and fund metrics of SPY vs QQQ.
The Spoos
No other fund encapsulates the spirit of an ETF better than SPY. This fund (NYSEARCA:SPY) was the first exchange-traded product to be introduced back in 1993 and is still the largest U.S.-listed ETF with over $180 billion in assets.
As you probably already know, SPY tracks the S&P 500 Index (INDEXSP:.INX), which is a measure of the 500 largest stocks in the U.S. as compiled by Standard & Poor’s. Top holdings in SPY are currently represented by Apple Inc (NASDAQ:AAPL), Microsoft Corp (NASDAQ:MSFT), and Exxon Mobil Corp (NYSE:XOM). Each stock within the index is market-cap weighted to give the largest share of assets to the biggest companies.
The average 3-month daily trading volume of SPY is 100 million shares, which equates to $21 billion in notional value. It’s easily the most heavily traded ETF in terms of overall size on a daily basis. That makes for extremely tight spreads and excellent execution for those who are seeking to trade the market quickly.
I once had an institutional trading desk explain that “SPY trades like water”, meaning it’s in constant motion and can swallow up any reasonably sized trade without trouble. Furthermore, this fund charges a modest 0.095% net expense ratio on an annual basis.
The QQQ’s
One the other hand, the NASDAQ 100 ETF (NASDAQ:QQQ) has created its own alluring reputation as a growth-oriented and high beta way to access the market. This fund tracks the NASDAQ-100 Index (INDEXNASDAQ:NDX), which are the 100 largest non-financial companies on the NASDAQ stock exchange.
QQQ has traditionally been known as a “technology fund”, however its true makeup is much more diversified than many people realize. The tech sector makes up 54% of the QQQ portfolio, followed by consumer discretionary stocks at 22% and health care at 13%.
This index again takes a market-cap weighted approach, which places a very strong emphasis on its top holdings. The top 10 stocks account for nearly 50% of the total asset allocation of QQQ. For instance, Apple (AAPL) makes up 10% of QQQ compared to just 3% of SPY. Other top holdings include well-known names such as Amazon.com Inc (NASDAQ:AMZN) and Facebook Inc (NASDAQ:FB).
This ETF also trades a tremendous amount of volume every day as well. Three-month average volume on QQQ is listed at 26 million shares, which equates to nearly $3 billion in notional value. QQQ is the 9th largest ETF by total size with $35 billion in assets and charges a modestly higher expense ratio of 0.20%.
The Head To Head – SPY vs QQQ
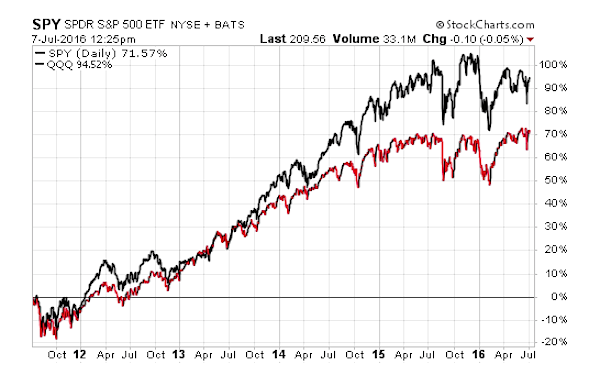
In a 5-year lookback of total return, the race isn’t even close. The chart below shows a significant divergence in performance between these two funds with QQQ being the winner.
The majority of this outperformance in QQQ was garnered by overweight exposure to top internet, consumer discretionary, and biotechnology stocks. These have been some of the strongest momentum players over the last half decade.
However, it’s worth pointing out that the greater performance in QQQ also came with an associated uptick in volatility as well. Nearly every downturn over this time frame resulted in a sharper decline for these high momentum stocks compared to the broad-market SPY. That’s something to be noted for those who have a more muted appetite for risk.
Furthermore, QQQ has significant battle scars from its devastating losses during the tech bubble of the early 2000s. This ETF fell -83% from high to low during that fiasco. SPY only lost -47% over the same time frame.
The Bottom Line
Both ETFs offer a very easy way to access a diverse group of large-cap stocks and can be suitable as long-term investment vehicles or short-term trading tools. The choice between the two may simply come down to experience, stock exposure, or even risk tolerance.
Thanks for reading.
Twitter: @fabiancapital
Read more on Dave’s Blog.
The author of his clients may hold positions in mentioned securities. Any opinions expressed herein are solely those of the author, and do not in any way represent the views or opinions of any other person or entity.


