 The market accelerated to the downside today, and you’ve probably heard the adage by now, “Don’t try to catch a falling knife.” There are various technical analysis and fundamental tools that offer us approximations so we can take a measured approach to getting back involved. And I find the best way to do that is to combine them to look within the market using intermarket analysis. I think it allows investors to block out the noise of panics while offering perspective into when/where the selling may end. And you can do intermarket analysis across a broad spectrum of vehicles.
Rarely, does an “event” take place without a corresponding event elsewhere. With this in mind, I’d like to share three intermarket charts that I think provide a nice window into what’s happening within this correction. Investors will want to keep an eye on these charts should the selling and confusion continue to build.
The Autos
The auto sector represents a great American pastime. Last week we shared that Financials and Cyclicals are two sectors that often turn up even as the general economy continues to slow. They are, also, amongst the first to tell us when things are not as rosy as the prior trend would imply.
Below is the weekly chart of Ford Motor Inc (F). Over the last couple of years and even the last decade, Ford either bottoms with or just ahead of the general market. Look below at the volume and note that volume often rises at pivotal points in the trend. In this case, it is also worth noting that the band that is coming up is supported by a large mass of bulls who entered in this area. Battle zones of the past tend to become battle zones in the future.
Furthermore, it may be worth following F over the coming weeks and seeing how it reacts when the bulls regain control.
As well, you can get a bird’s eye view of Ford’s performance through the stages by reading my October 2013 post on TraderPlanet.
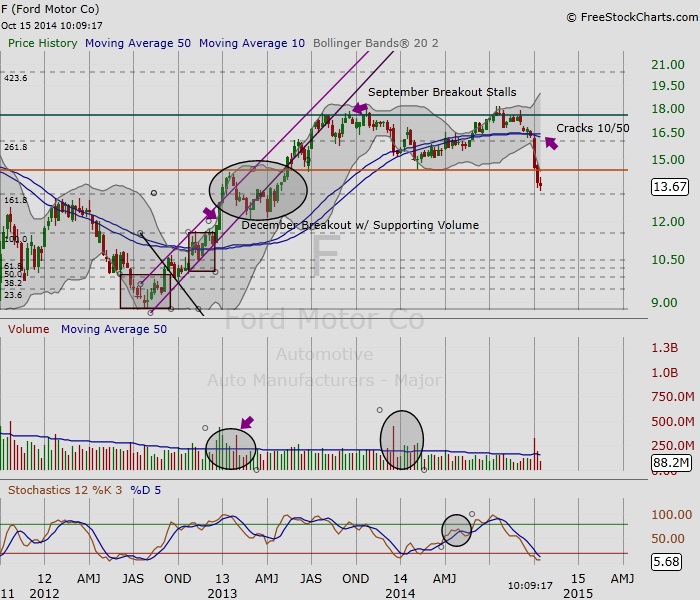
Figure 1, Weekly Chart of Ford Motor Co., F.
Long Term Bond Market
The long-term bond market weaves an interesting story depicting key periods of the financial crisis here in the U.S. and with our trading partners. Today, long-term bonds can be used in intermarket analysis to offer perspective into just how bad we really believe the economy is (today) and what we can expect going forward. Notice that the 20+ year US Treasury Bond Fund (TLT) peaked in the summer of 2012 in line with the Euro Summit. Today, there’s concern about Europe again, but the question as TLT approaches the next level of resistance is whether the market believes that things are as bad as they were then.
Similar to Ford’s forward looking qualities, the long-term bond market is often the first to tell us when the economy is slowing. Notice, that TLT began building a base in the fall of 2013 around the time that the breakout attempt for F failed.
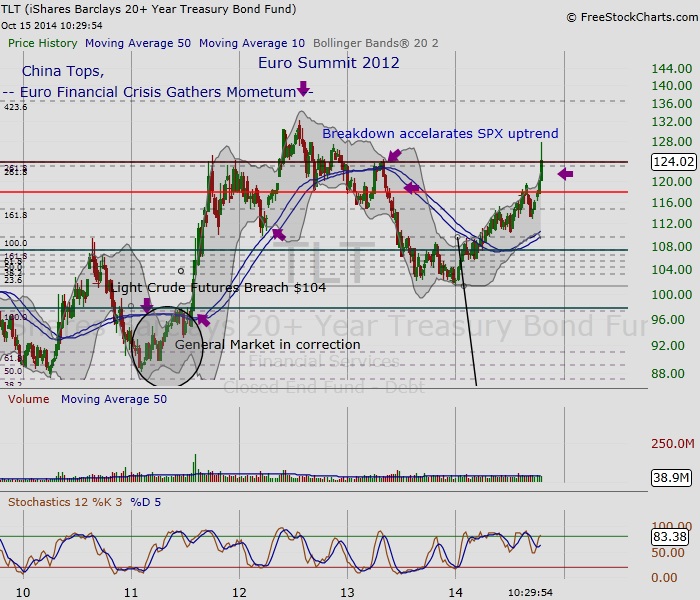
Figure 2, Weekly Chart of 20+ year US Treasury, TLT.
Crude Oil
No intermarket study is complete without taking Crude Oil into account. Today, Light Crude Futures (CL) slammed through the summer 2013 floor. Like the TLT, Oil is approaching 2012 support levels. It is time again to question our intuition about how the economy feels today compared to 2012.
Either way, the markets will be looking for support at the 2012 levels. For further reference, you can read my post about the lead/lag relationship of oil with the economy and equities.
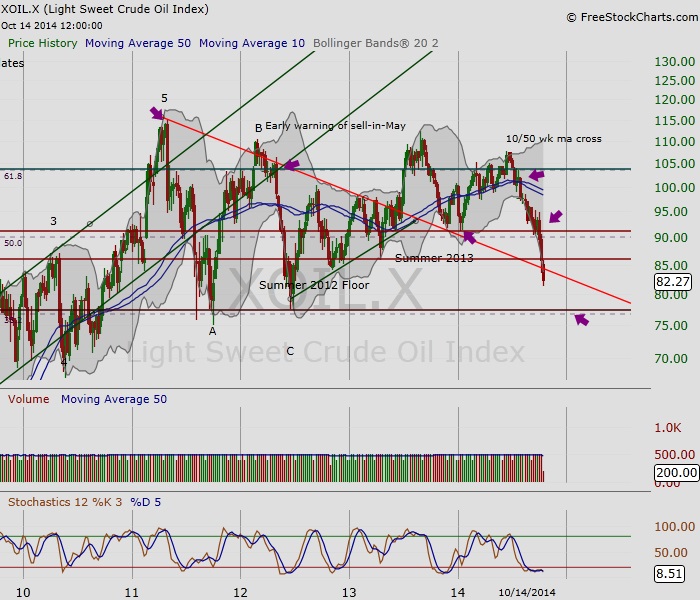
Figure 3, Weekly Chart of Light Crude Futures
Thank you for Reading.
Follow Maria on Twitter: @rinehartmaria
No position in any of the mentioned securities at the time of publication. Any opinions expressed herein are solely those of the author, and do not in any way represent the views or opinions of any other person or entity.


")


