Just a four months ago, I provided an update on Intel stock (INTC) that included some lower INTC price targets where bulls could look to get long the stock. To sum it up, I thought Intel stock had a good shot at finding support in the 25-28 area, as there was a confluence of INTC price targets showing up within that range (via math, fibs, and trend support).
Although prices dipped ever so slightly below that INTC price target area, the stock did bounce right off the trend line shown in that post. And a big rally has taken shape.
Feel free to go back and look at the chart in that post. Here’s a brief excerpt:
“…there is a cluster of price support targets nearby. If INTC stock is going to begin another run higher, it will likely be from one of these support levels.”
Another piece of that post that bore importance was the fact that Intel stock price broke out of pretty large base and the INTC price target zone (highlighted in that post) included a projected return to that breakout area (before another wave higher).
Check. Check.
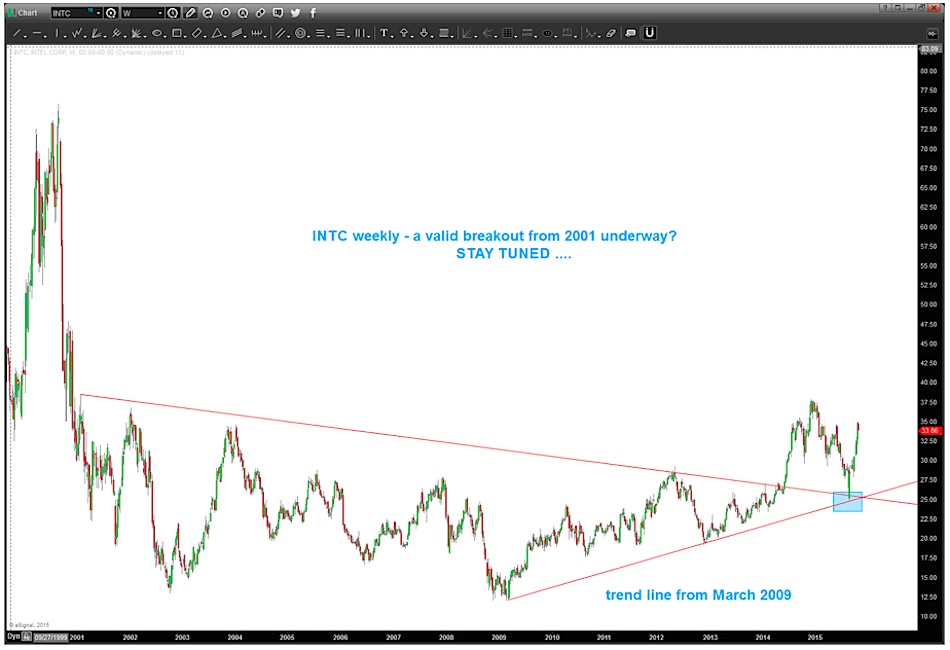
Fast forward to today and as you can see from the chart below, the stock price has soared back to 34. It’s been a pretty big rally over a short duration, so if you are bullish on Intel stock (INTC) then it may pay to be patient wait for a nice, orderly corrective pullback in form and proportion.
But from a longer-term perspective, it certainly appears that INTC has the potential to move higher.

Here’s a longer term look of the Intel stock “breakout” we are seeing/discussing here.
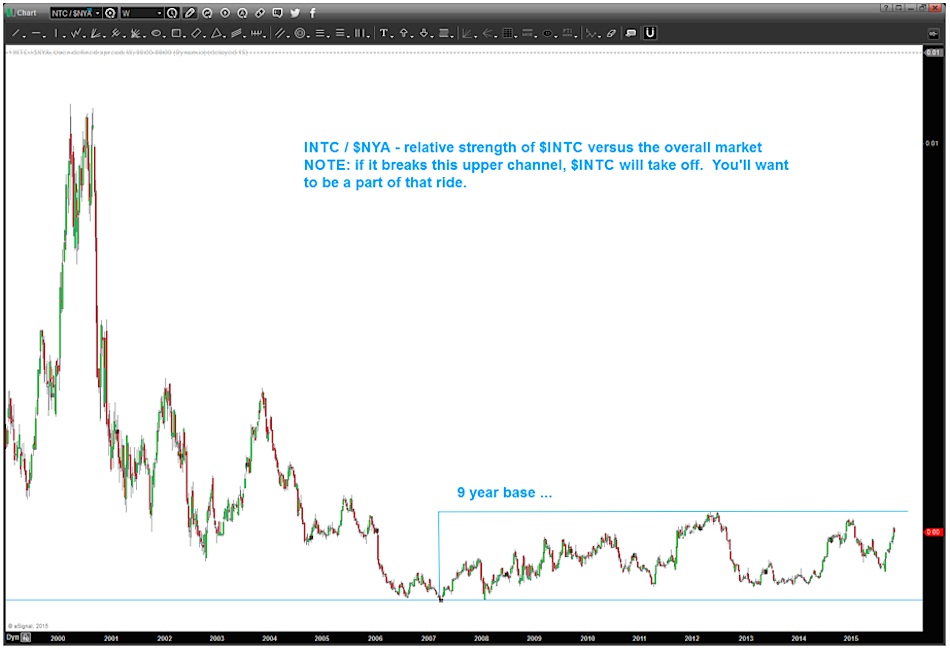
One last thought here. Let’s take a look at the relative strength of INTC versus the broader market. Why? We are trying to identify institutional rotation.
As you can see from the chart below it’s been dead since 2007 and since 2000 it’s been in a pretty pronounced down trend. Now, it’s put in a series of higher bottoms since the all-time low in 2007, Keep an eye on this one… if the ratio breaks that channel to the upside, it “should” really take off and put higher INTC price targets into view.
Thanks for reading.
Twitter: @BartsCharts
Author does not have a position in mentioned securities at the time of publication. Any opinions expressed herein are solely those of the author, and do not in any way represent the views or opinions of any other person or entity.
 Ready To Break Out?")


")


