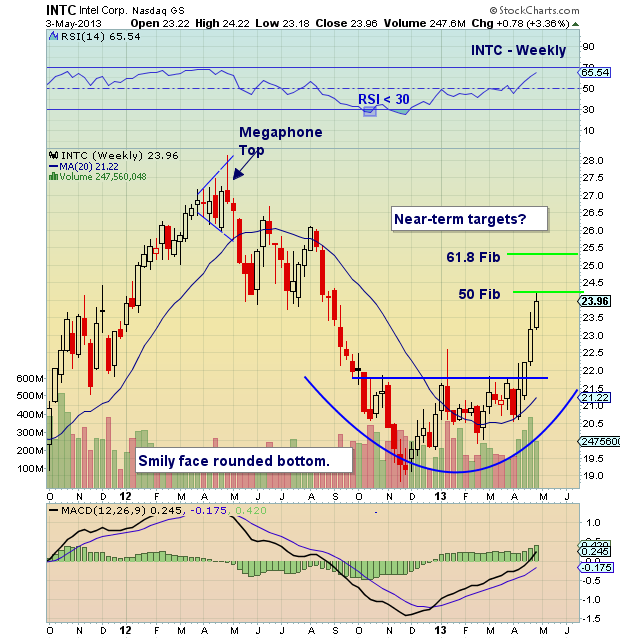
After slipping out of a megaphone top last spring, Intel Corp (INTC) stock price slipped roughly 30 percent before bottoming in November. That bottom was formed between October and March, setting up the recent April/May breakout higher. As you can see in the INTC stock analysis below, price formed a nice smily face rounded bottom (multi-month basing with breakout over the neckline).
After rocketing higher in April, INTC is closing in on its first target/resistance, the 50 percent Fibonacci retracement level. Above this level comes the 61.8 fib. And furthermore, if INTC is going to make a serious move to recapture its 2012 highs, it will need to take out this key fib. But this would likely occur after a period of consolidation near one of these Fibonacci levels. See the annotated chart below.
INTC Stock Analysis – Annotated Daily Chart
Thanks for reading. Trade safe, trade disciplined.
Twitter: @andrewnyquist and @seeitmarket
No position in any of the mentioned securities at the time of publication.
: Worrisome to Broader Market?")

: Important Breakout Retest")
