Last week we did an in-depth review of the largest technology ETFs and their associated price action. As a follow-up to that post, we want to dig deeper into both hardware and software indexes within the overarching technology realm. Today we’ll look at both semiconductor ETFs and software ETFs.
One of the benefits of ETF investing is the ability to pinpoint exact exposure within any given sector to identify diverging components or simply tailor your portfolio to a specific theme. With that goal in mind, let’s lift the veil on some of the most prominent trend-setters within the software and semiconductor ETFs space.
KNOW WHAT YOU OWN: Software and Semiconductor ETFs
Reviewing The Playing Field – David Fabian
The largest semiconductor ETF by size is the iShares PHLX Semiconductors ETF (SOXX), which has $441 million dedicated to a basket of 30 U.S.-based stocks. While there is an implied level of diversification in this fund, it should be noted that the top 5 holdings control more than 41% of the total assets.
That gives a strong consideration in SOXX to powerhouse firms such as Broadcom LTD (AVGO), Texas Instruments (TXN), and of course Intel Corp (INTC). The components and underlying weighting of the SOXX index is controlled by the NASDAQ Group using a modified capitalization weighted methodology.
Another well-known name in the semiconductor space is the VanEck Vectors Semiconductors ETF (SMH). This ETF takes a more global approach by incorporating international stocks in its mix. SMH owns the 25 largest semiconductor companies that engineer and produce chips.
Note that this research is a collaborative review by David Fabian & Aaron Jackson. Check out more “Know What You Own” studies on ETF investing.
Only 65% of the SMH portfolio is located in the United States, with the remaining 35% spread amongst Taiwan, Netherlands, Singapore, and the United Kingdom. The differentiated holdings between this fund and SOXX means that SMH offers a variant fundamental and technical appeal.
Moving to the software side of the tech sector, the iShares North American Tech-Software ETF (IGV) is the most popular game in town. This ETF has $722 million dedicated to nearly 60 stocks in the software industry. Top holdings include household names such as: Adobe Systems (ADBE) and Salesforce.com Inc (CRM).
IGV allows targeted access to a select group of U.S. and Canada-focused holdings with noticeably more diverse index construction criteria. The larger number of holdings allows for broader appeal than strictly one niche of the technology segment.
Technical Review – Aaron Jackson
IGV has a potentially large head and shoulders top pattern forming. There are two key observations to note.
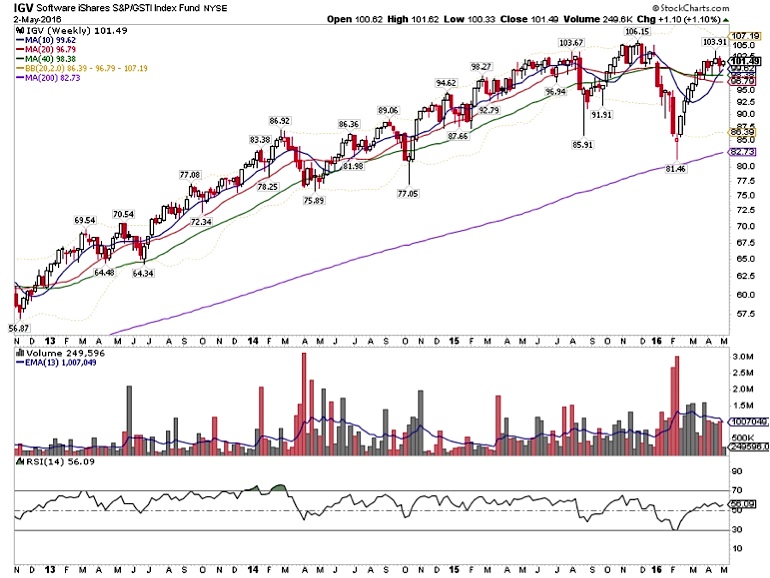
- We’re stuck between this major supply zone around 103 and the major support zone in the low 80s. That area is also the neckline
- Notice the low RSI range. That’s bearish for the time being.
Turning our attention to semiconductor ETFs, we can see we’re at the top of another large trading range.
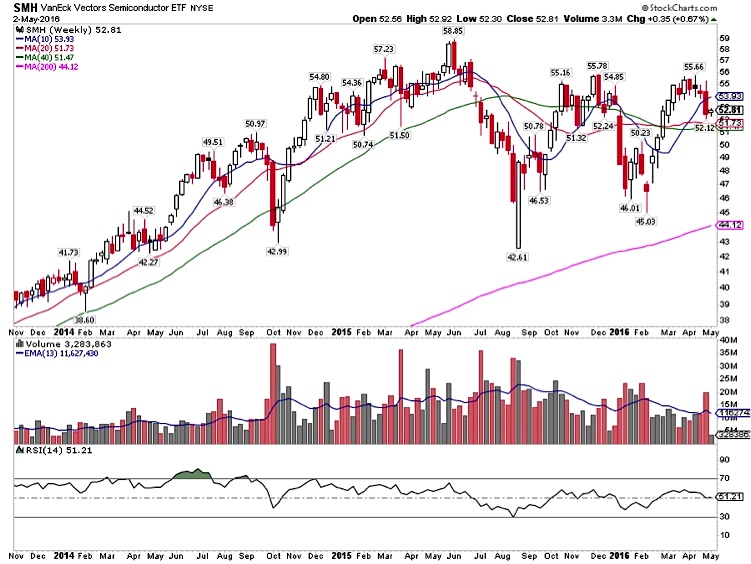
- The range is from 45 to 55, with added support around 42.
- The RSI range between ~40-60 confirms a trendless, range-bound market.
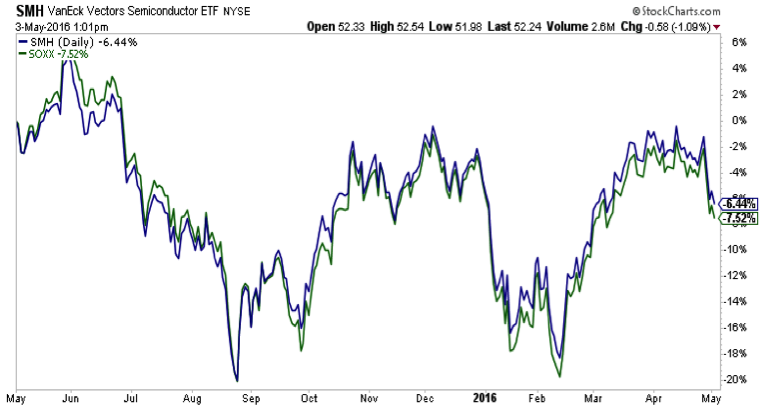
Finally, let’s compare the two semiconductor funds performance. There really isn’t much of a performance difference between the two funds.
Conclusions:
- Differentiation can be minimal when choosing between industry ETFs. In that case, it’s better to choose a fund based on factors like expense ratios.
- Technology funds are at the top of a very wide range. The Risk-Reward favors bears for now.
Thanks for reading!
This article is part of a series co-authored by David Fabian (fmdcapital.com) and Aaron Jackson (northstarta.com). Each week we will be unlocking the secrets to some of the most talked-about exchange-traded funds in the market. The goal is to better understand what you own or elevate new ideas to the forefront of your watch list.
Twitter: @fabiancapital @ATMCharts
The authors may hold a position in the mentioned securities at the time of publication. Any opinions expressed herein are solely those of the authors, and do not in any way represent the views or opinions of each other or any other person or entity.
")


 Rolling Over At Key Fibonacci Level?")