Amidst the larger context of an equity market that seems to be way out on the teetering limb of a reflexive rally so full of its own bullish virtue that it might’ve finally jumped the V-Bottom shark, small cap benchmark index Russell 2000 (RUT) – broadly shunned in favor of larger companies all year – has actually registered an expansion in upside individual stock participation over the past several sessions.
Below, the four colored lines plot “Composite Participation” against the Ishares Russell 2000 ETF (IWM) a study constructed by 1) averaging the percentage of Russell 2000 components above their 20, 50, 100 and 200-Day Simple Moving Averages (SMA), and then 2) smoothing that average with 5, 10, 20, and 50 Exponential (front-weighted) Moving Averages (EMA), rendering a noisy multi-timeframe view of index breadth into a simple “wave”. This composite measure is almost entirely above September’s high (only the 50-Day remains below) and beginning to encroach on early July’s levels, coinciding with R2k’s all-time highs.
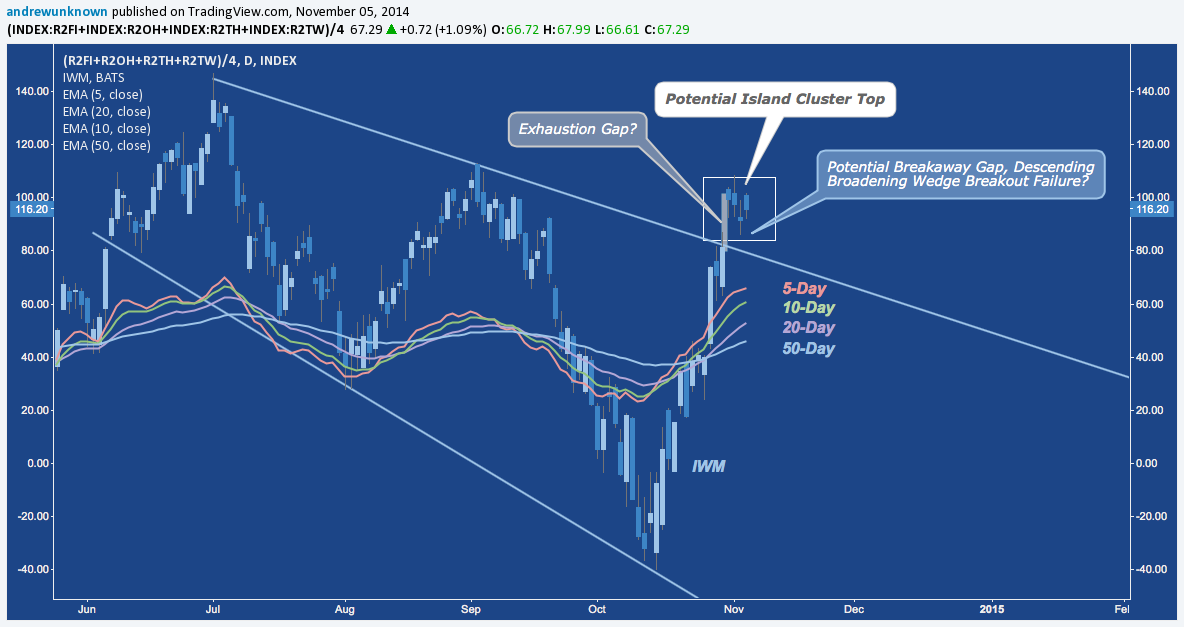
A point of potential concern here is how the Russell 2000 has stalled out following last Friday, 10/31’s Bank of Japan/QQE-induced gap higher above Descending Broadening Wedge (DBW) resistance. The 4 sessions since have created a potential multi-day Island Reversal, consisting of Friday’s gap-up and a series of comparatively tight, churning sessions with no directional resolution. Island Top confirmation would come with a gap down that opens at or below last Thursday, 10/30/14’s close near 115. This could be a Long Island pattern that will go on to spur a continuation higher; but the jury is out until this week’s range between 115.28-117.37 resolves. In contrast, a gap low threatens to negate the DBW breakout if price falls back into the pattern – a technical event that often signals renewed weakness.
Applying the “Composite Participation” measure to the S&P 500 (SPX) on its weekly chart, the “larger context” mentioned above, we see another point of non-confirmation. Here we see that the latest v-Bottom rally has induced a short-term reversal in individual stock participation on the lower timeframes. However, for a price reversal that features a positive RoC (details here) greater than any rally since October 2011, it reflects a very underwhelming response.
The net result: SPX makes a new nominal higher high (to the trend line resistance imposed by it’s multi-month Broadening Top pattern ) as the trend in individual stock participation continues to deteriorate.
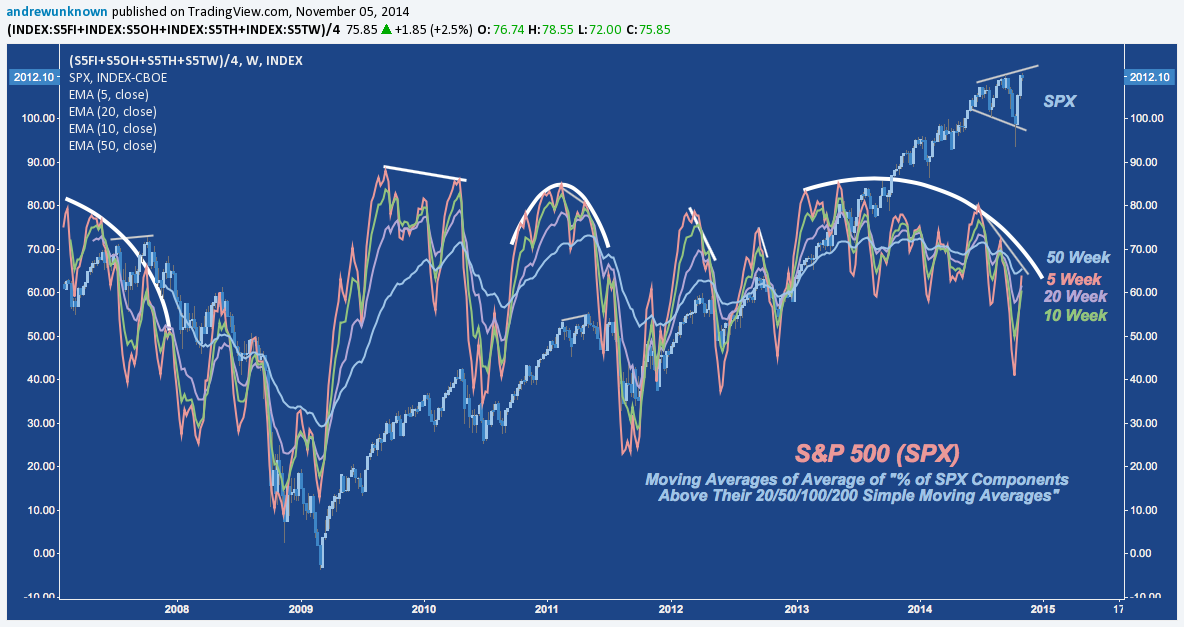
This “price v. participation” negative divergence – one that has been building for over 18 months! – may prove an ephemeral concern if the latest V-bottom does prove to be a lasting refutation of the wobbliness in US stocks that has characterized much of 2014. Over the last several months, though, it has become an escalating concern that will – at best – prevent SPX from meaningfully advancing until it is resolved.
Trade ’em Well.
Twitter: @andrewunknown
Kassen holds no exposure to securities/instruments mentioned at the time of publication. Commentary provided above is for educational purposes only and in no way constitutes trading or investment advice.
")


 Rolling Over At Key Fibonacci Level?")


