As investors, there are a myriad of things to look for and navigate through when choosing which stocks to purchase. Strong momentum, solid earnings growth, certain technical indicators, etc. Today we will look at the relevance of the way a stock trades and how it sets up.
When contemplating which equities to enter, I like to look for names that trade tightly, whether that be on a daily or weekly basis. Wide and loose trade are hallmarks of bearish characteristics, and those stocks are more likely to underperform. So let’s take a look at some examples that we owned at some point in 2014 to get some perspective on tight trading setups.
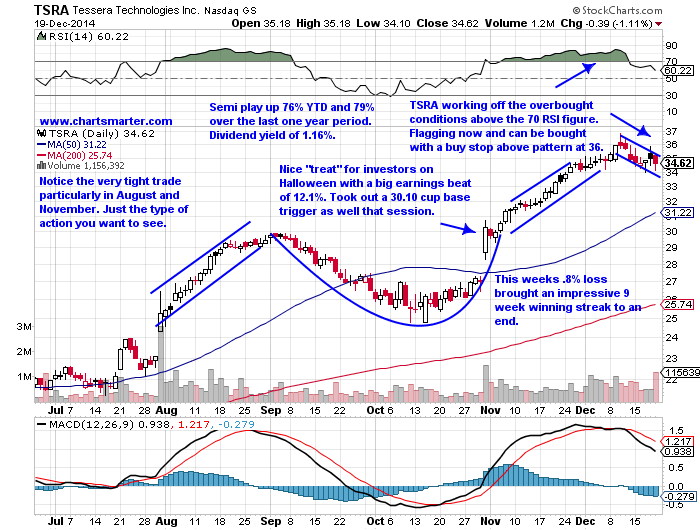
The semiconductor group has been among the best performing sectors of the market. And as I decide which names to potentially enter I look for stocks that display taut behavior. As you can see in the chart below, Tessera Technologies (TSRA) fits that bill. If one took a look at the weekly chart one would see the very same tight trading as well. And this has led to numerous breakouts. The first came on a $22.69 flat base trigger that was taken out on 3/10. That happened to be an 8 month long base and, remember, the lengthier the base, the greater the chances for success. TSRA also took out a $24.01 flat base trigger on 7/22 and most recently broke away from a $30.10 cup base trigger. All throughout, even during downtrends, notice how smooth trade was. That has led to nice YTD gain of 76%.
TSRA Trading Setups – 2014
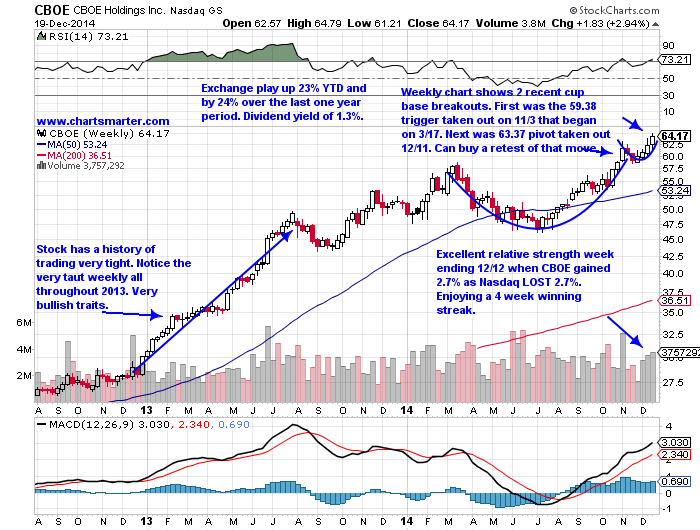
CBOE Holdings (CBOE) is an exchange play whose names have begun to excel. The group has several peers which are shouldering some of the weight, which is good (rarely is it a good sign when your stock is the only one performing well – eventually it will succumb to its own weight). Other peers performing well include NDAQ, CME, and ICE.
Let’s take a look at the chart below. CBOE has traded very tight ever since reclaiming its 50 day SMA after a well received earnings report on 8/1, gaining 2.6%. Its last report rose 0.9% on 10/31 and proceeded to gain 5% the following week. This benign action has resulted in two recent breakouts from cup base triggers of $59.38 on 11/3 and more recently a $63.37 pivot on 12/11.
CBOE Trading Setups Chart – 2014
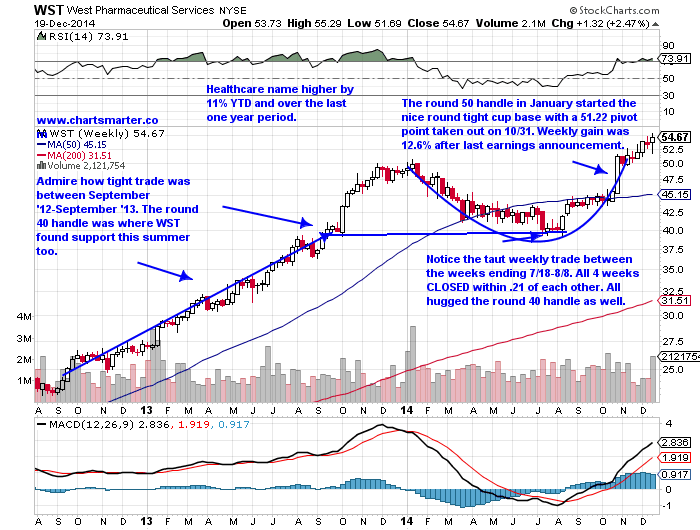
West Pharmaceutical Services (WST) is among the strong healthcare group which is higher by 11% YTD and over the last one year period. It now sits just 1% off all time highs. Round numbers came into play as the stock nestled along the round “50” dollar number in January (which served as resistance). It then found support along the 40 dollar handle as it built the bottom of a good looking cup base in July and August. WST traded in a very taut fashion on a weekly basis numerous times. Between the weeks ending 7/18-8/8 all 4 weeks CLOSED within .21 of each other. The 5 weeks ending 9/19-10/17 all closed with a 44 dollar handle. It then proceeded to take out a $51.22 cup base trigger on 10/31, just one day after a very well received earnings report.
WST Trading Setups Chart – 2014
Follow Douglas on Twitter: @chartsmarter
No position in any of the mentioned securities at the time of publication. Any opinions expressed herein are solely those of the author, and do not in any way represent the views or opinions of any other person or entity.


