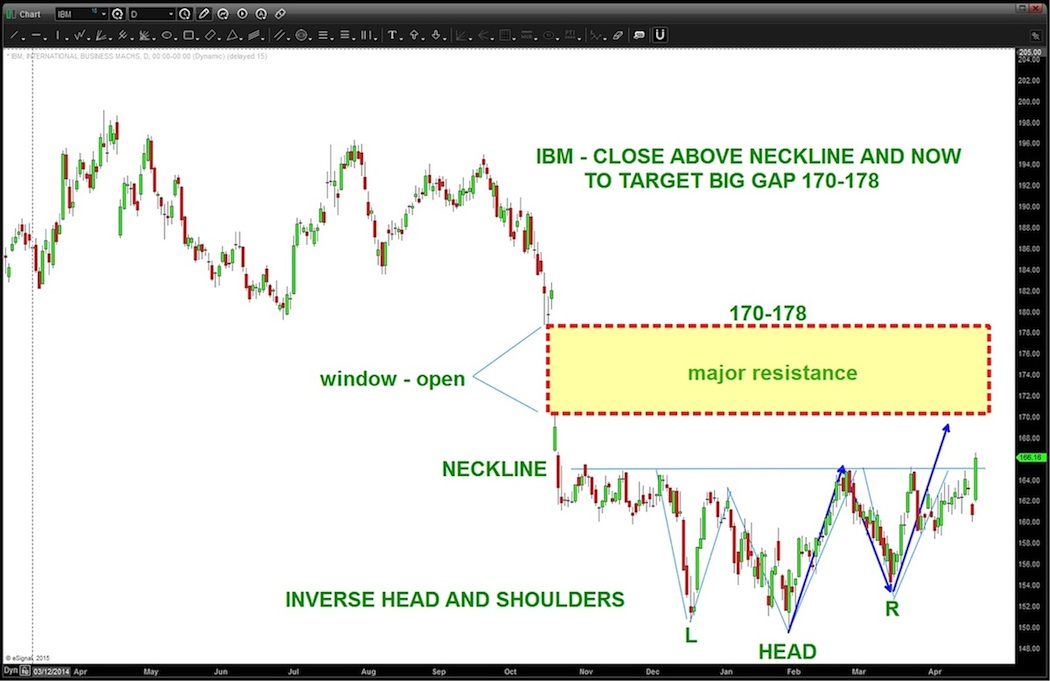
After IBM’s strong close on Monday, I decided to put together an update on IBM’s chart and current stock price pattern. For further context, please read my December post on why IBM may be headed higher in 2015.
The most interesting development is the breakout above neckline resistance. If the breakout holds, investors will have an 8 dollar gap staring them in the face. That will be a big test. If IBM can overcome that area of resistance, then I believe she will be off and running.
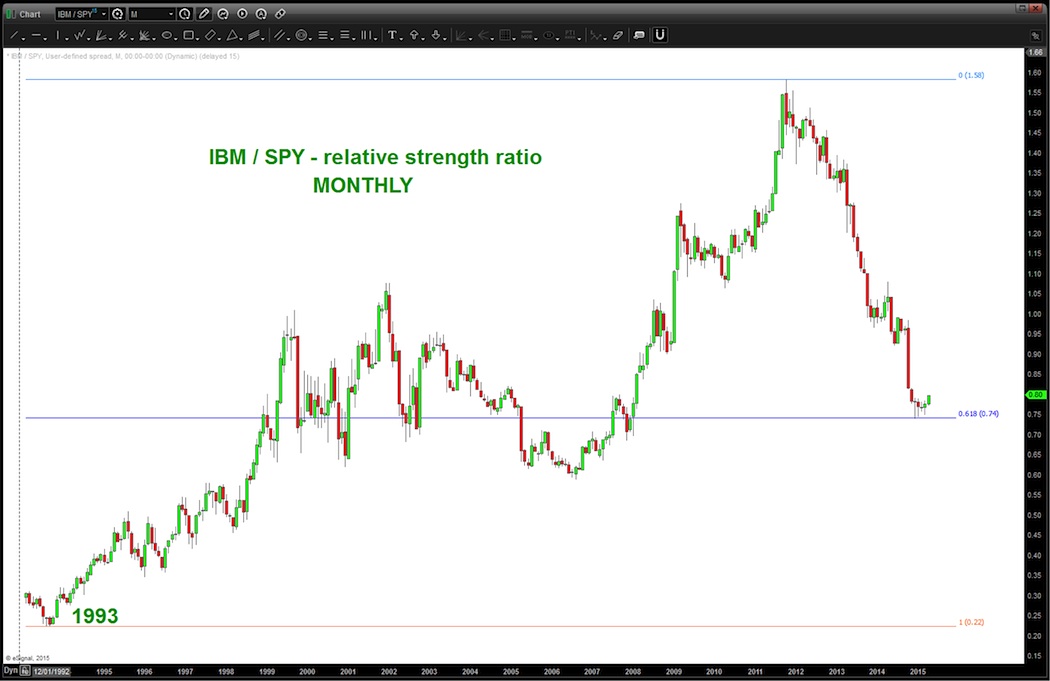
Now let’s look at a relative strength chart – see below. I am comparing IBM’s stock price to the S&P 500. Note the long term node from 1993 (22 years) that has held price at the .618 Fibonacci retracement level and, depending on the monthly close, rotation is – quite possibly – is moving into IBM. Again, this is based on a relative strength ratio. If the chart starts heading higher then IBM is outperforming the broader S&P 500 on a relative basis. It appears to be moving in that direction.
Trade safe and thanks for reading.
Follow Bart on Twitter: @BartsCharts
No position in any of the mentioned securities at the time of publication. Any opinions expressed herein are solely those of the author, and do not in any way represent the views or opinions of any other person or entity.

 Rolling Over At Key Fibonacci Level?")


