 By Alex Bernal With much of the commodities space taking a hard tumble in recent weeks. I wanted to showcase a very useful tool that I use in my commodities analysis and trading: The Commitment of Trader Report (The COT Report).
Every Friday the Commodity Futures Trading Commission (CFTC) releases the COT Report which aggregates all the futures positions of every major player in the futures markets.
The aggregate data is broken down into different commodity groups and by 3 Basic types of traders.
1. Commercial Hedgers
2. Large Trader
3. Small Speculators
The Largest positions are typically held by commercial institutions or “hedgers” that have the indent actually taking delivery of the underlying commodity. Commercials are considered the most knowledgeable & are the most important group to keep tabs on.
The next largest player is typically the “Large Speculators, which include Hedge Funds or CTA Trading Pools. These guys are much smaller than the overall commercial positions and on average do not have the intent on taking delivery of any of the under lying commodities they are trading. They are trading purely for profit and their actions are often less valuable to watch because they typically trade Future Spreads (Calendars) or Married positions (futures + options).
The last group is call the Small Speculators or what some people call “dumb” money. This group is considered the small guy or 1 lot crowd. It is also typically seen that this group is the most ill-informed and thus should be “faded” or traded contrarian too. I have not really found this to be the case but there are times when this group does reach pretty extreme readings.
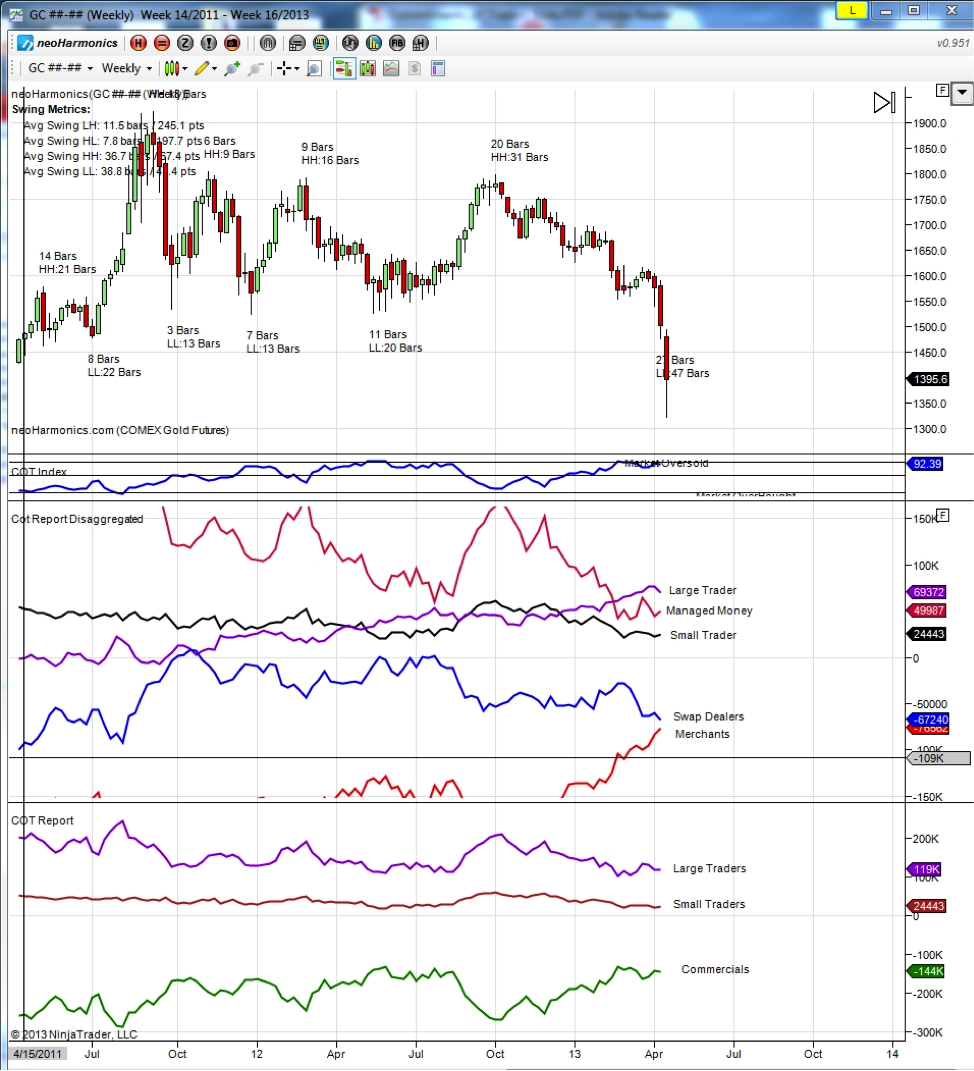
Managed Money, Merchants & Swap Dealers are three new disaggregation’s that have only been available in recent times that can further splice up the Commercial and Large Speculator positions in to even more specific categories. This is because of the growth in Commodity Index Funds or ETFs that perpetually hold long positions in the commodity (i.e. GLD or VXX). See Chart Below
Large Trader – Purple
Managed Money Crimson
Merchant Red
Small Trader Black
Swap dealers blue
GOLD Futures Chart with COT Report
So we get the data for free now what?
This was the first thought I had when I started trying to analyze this data. At first glance it did not seem particularly useful in anyway because it was just a snap shot of what traders DID not what they will necessarily DO next. But the old saying “you cant turn a tanker on a dime” does lay way to how the commercial paper effects future prices in the commodity.
COMMERCIALS, COMMERCIALS, COMMERCIALS
It was only after studying the works of a few experts like Larry Williams, Steve Breise, Floyd Upperman, and Jake Bernstein that I fully realized one portion of the participants are FAR more important to watch than the others : The Commercials. The Big Whales, The Deep Pockets The Deciders. These are the guys that when they make moves you will see the large scale ripple effects throughout the price of the commodity in question.
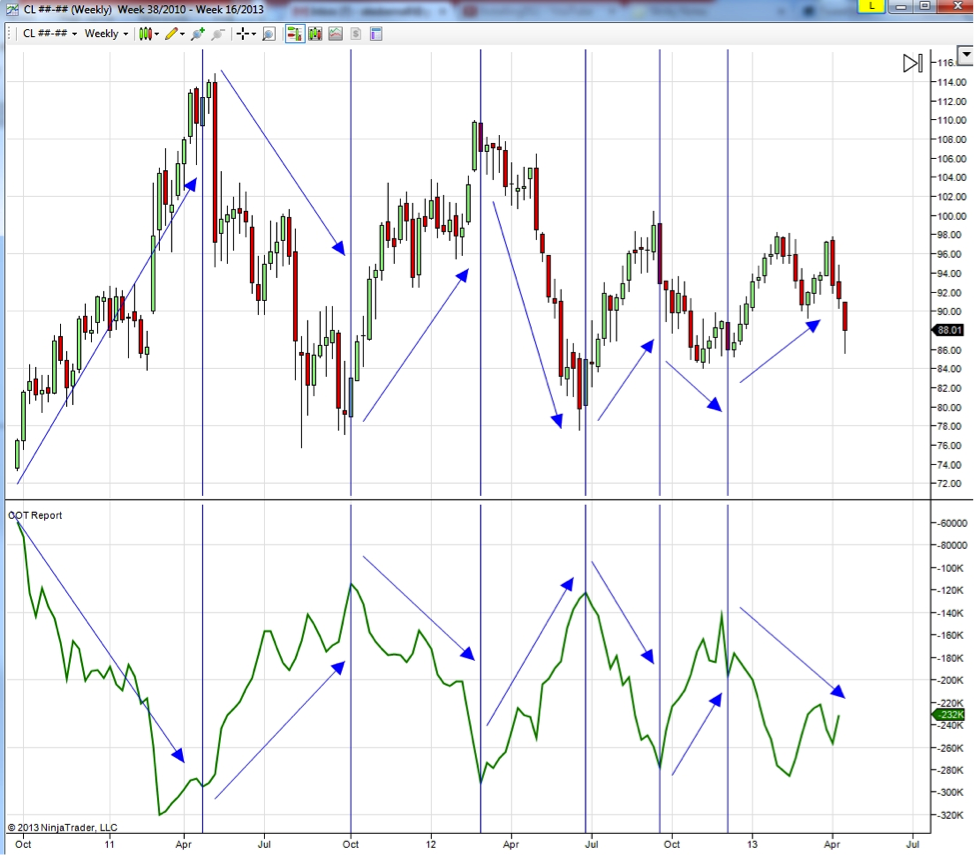
As you can see in the chart below the Commercial activity is often in the OPPOSITE direction of the markets trends. This is because they are actively buying when the market is going down and actively selling when the market is going up. They are the experts in their businesses they are often seen to be acting many months in advance of where they believe the price will be. Now this is not always the case and Commercials are not always a “sure thing” but they are the closest thing to a “predictor” that we can get. Also in the graph below I have isolated only the commercial movement and the Movement of Crude Oil over the last few years. It is very easy to see that the commercial movement dominates the overall price trend of oil.
Crude Oil Chart with COT Report data
The COT Index
So in order to further make use of this data in a way that can help us speculate on futures prices one common indicator that I want to show you how to construct is called the COT index.
The calculation is below
COT index = 100 x (current Net – Minimum Net) / (maximum Net – Minimum Net)
This indicator converts net futures positions to a 0% -100% scale (normalizes). Its now reflects where the current net positions rank as a percentage of its range over the recent past data (typically three years). I use this to watch for extremes reading in the commodities markets. A 90 % indicator suggests there has been a commercial buying climax. A 5% percent reading suggests a commercial selling climax. In short the the COT indicator tells me when the biggest most influential players are ALL IN either buying or selling futures. This is not necessary a call to action but rather an illuminating clue for possible trading setups. I never take trades merely on the COT Report data or COT Index but rather use my usual execution tools to confirm a new trend before I make a trade.
Cocoa Chart with COT Report data
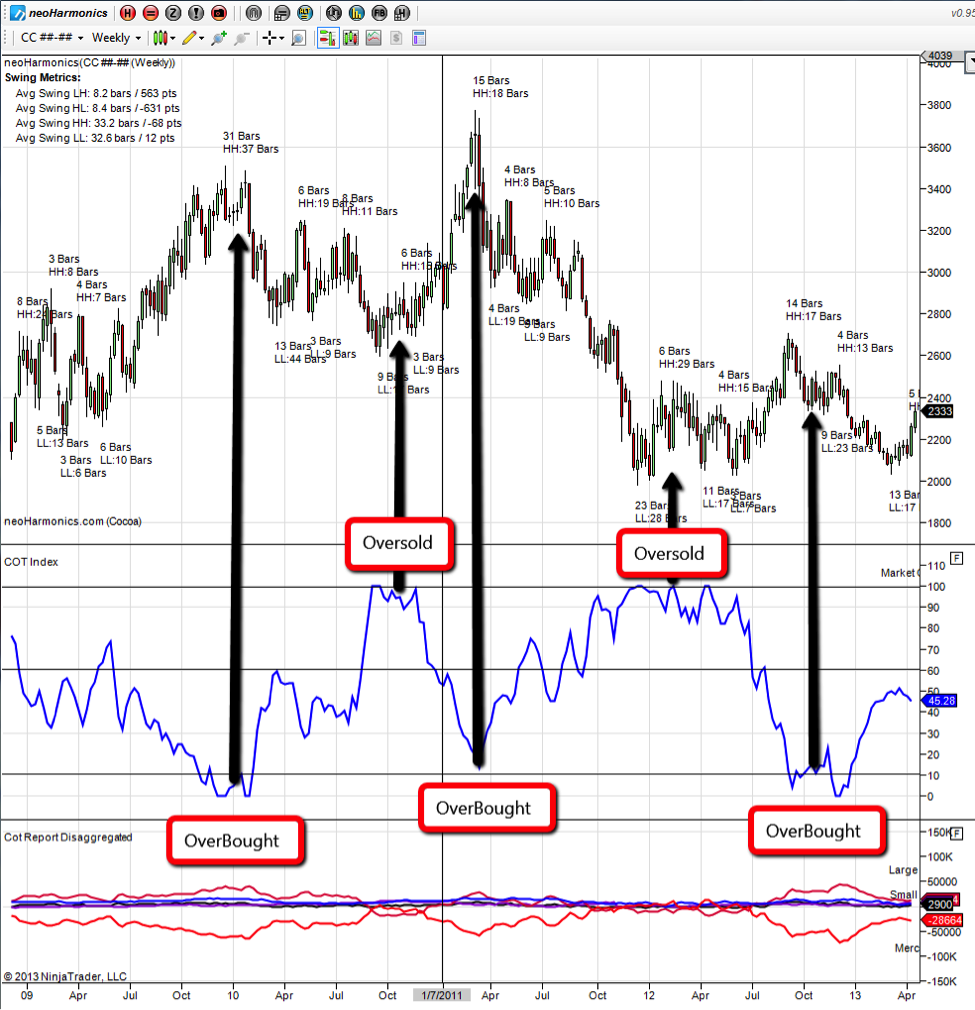
The graph above is a great example of how the COT index shows when the cocoa market was overbought or oversold during the past couple years.
Other COT Indicators
There are many other indicators that I have come across being applied to the COT Report data, some include:
1) Spread and Rate of Change of the difference between Commercials and Large speculators
2) Spread and Rate of Change between Swap Markets and Futures Markets
3) Cycle Analysis on the COT report raw data or COT index.
4) COT Index adjusted for seasonality
Drawbacks of this Data
1) IT IS LATE! After the fact! Be aware by the time you get this data it is at least a week old and large speculators and commercials can and do change positions quickly!
2) Markets can stay over bought and oversold for very long periods of time. Just because a COT Index extreme is reached doesn’t necessarily mean that the market will up and reverse right after if the commercials do not commit to a new direction of accumulation or distribution there will likely be no new trend change.
3) COT Report data does not account for possible “spreading” of positions. This can skew the data slightly in particular markets where calendar spreads are a large portion of the overall open interest.
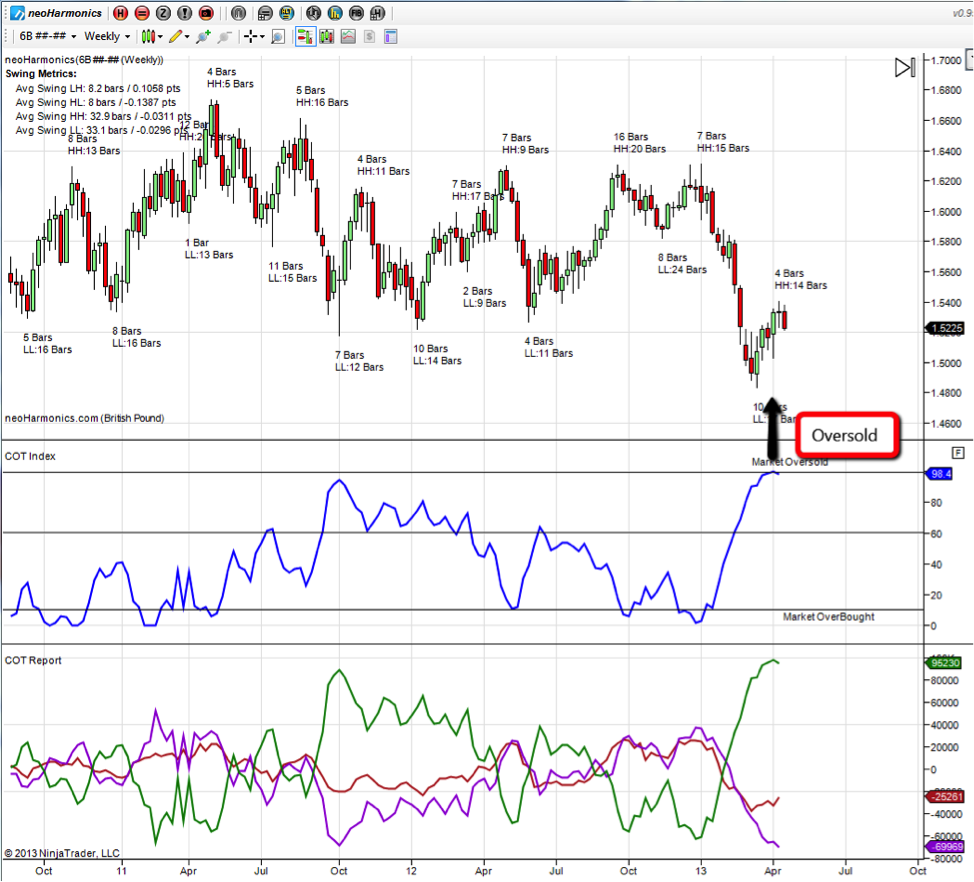
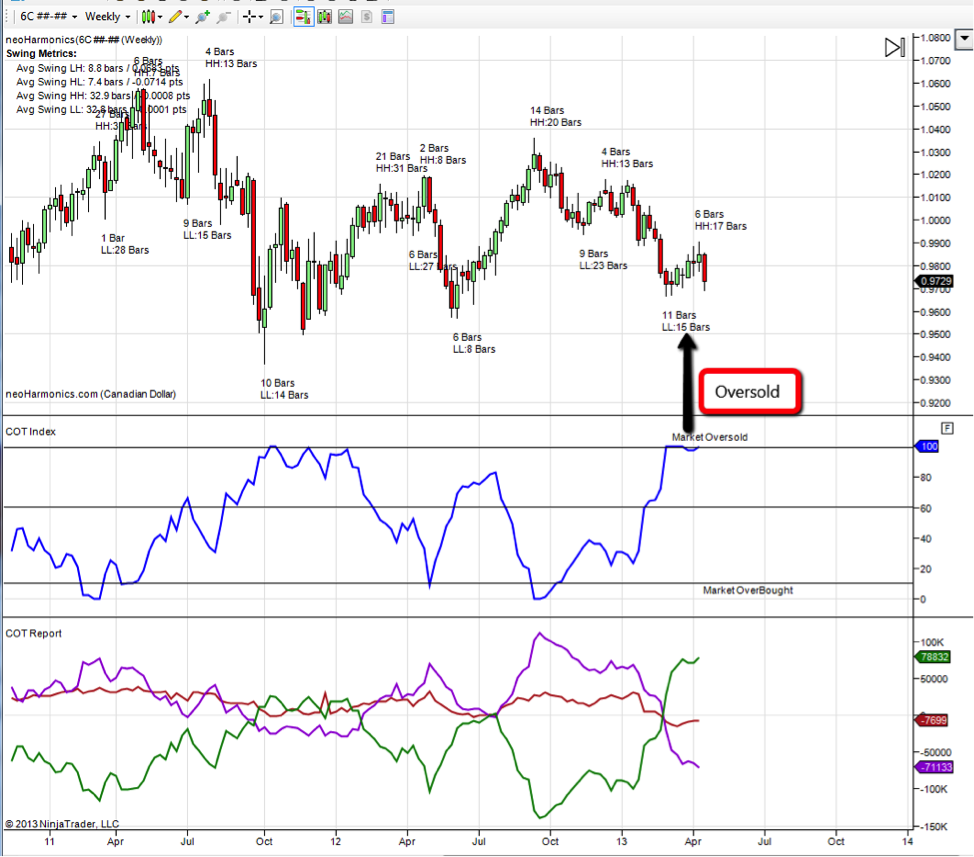
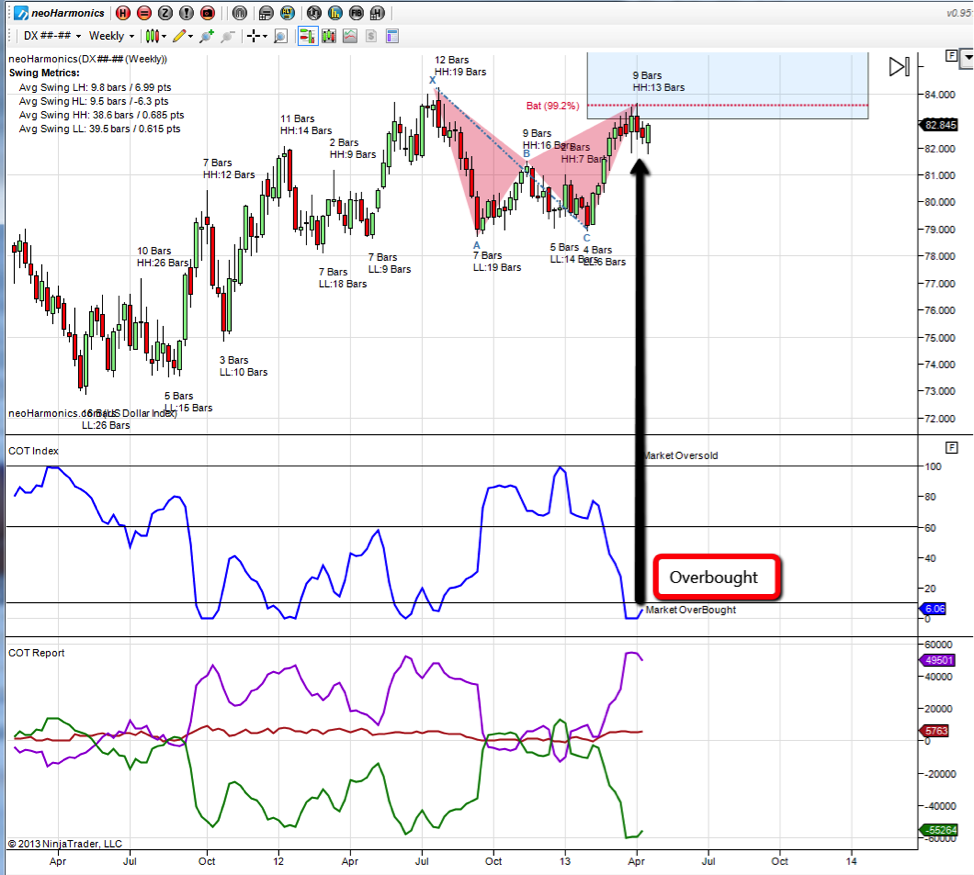
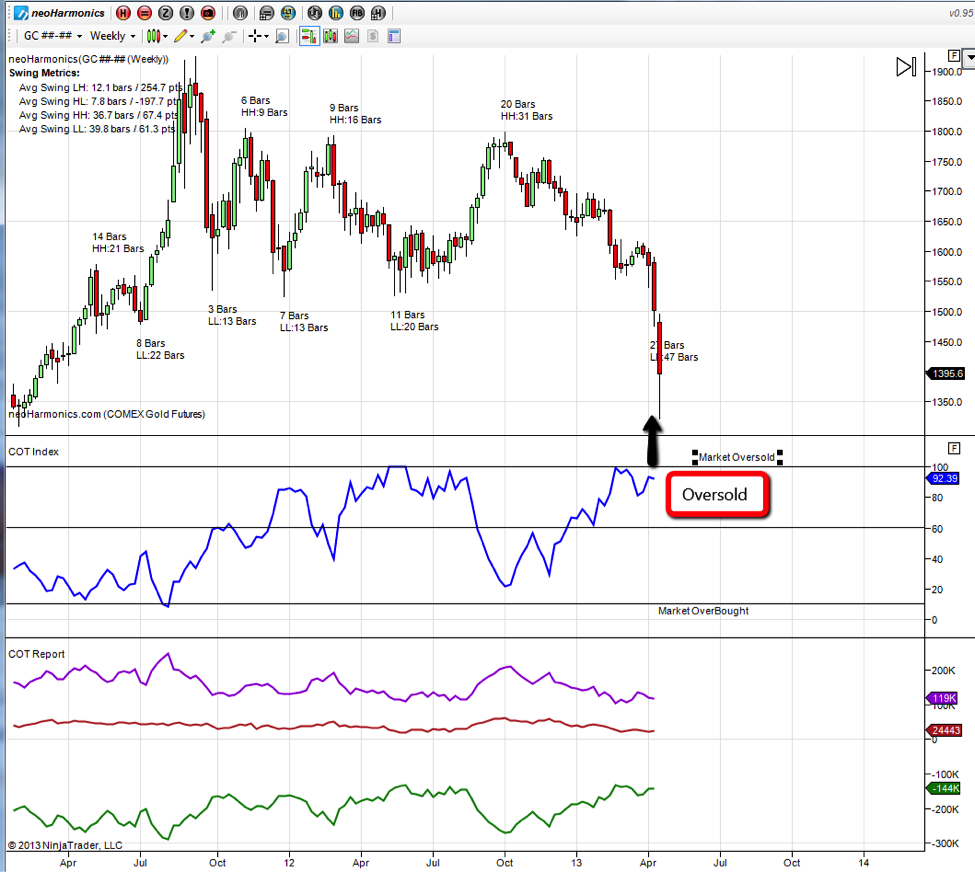
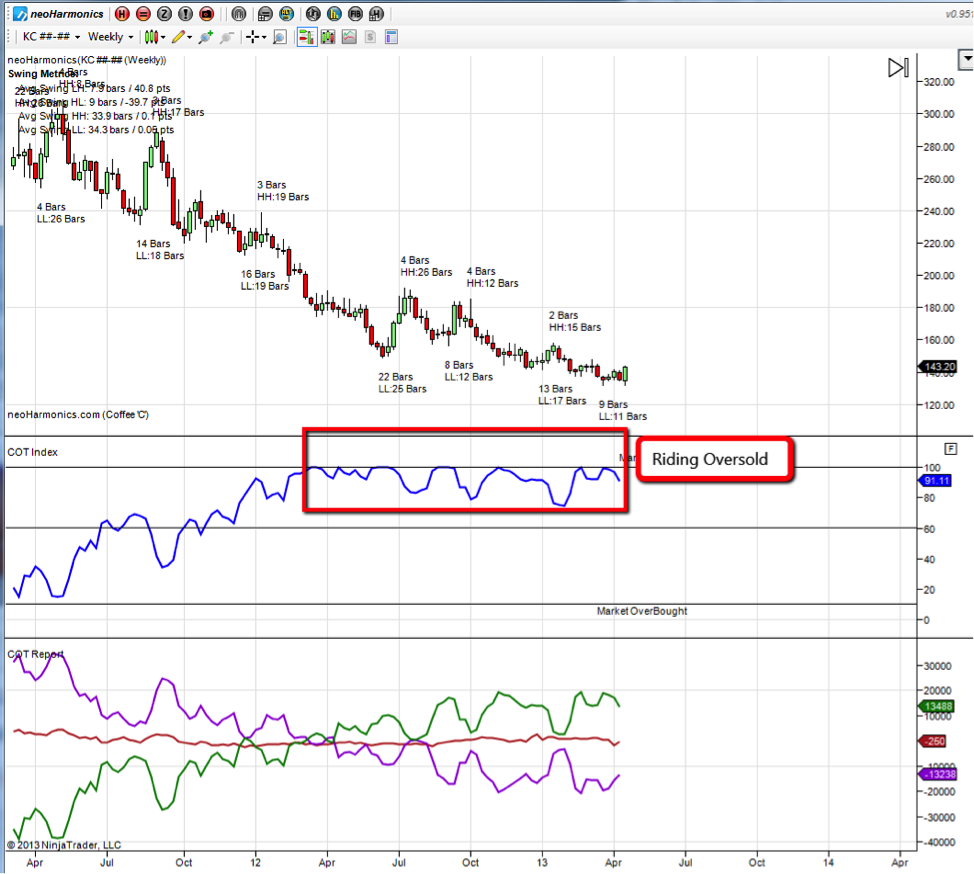
Lastly I want to leave you with some graphs of current commodities markets on their current COT and Index Positions that I believe are at important inflection points.
Happy Trading!
British Pound with COT Report data
Canadian Dollar with COT Report data
US Dollar Chart with COT Report data
Gold Chart with COT Report data
Copper Chart with COT Report data

Coffee Chart with COT Report data
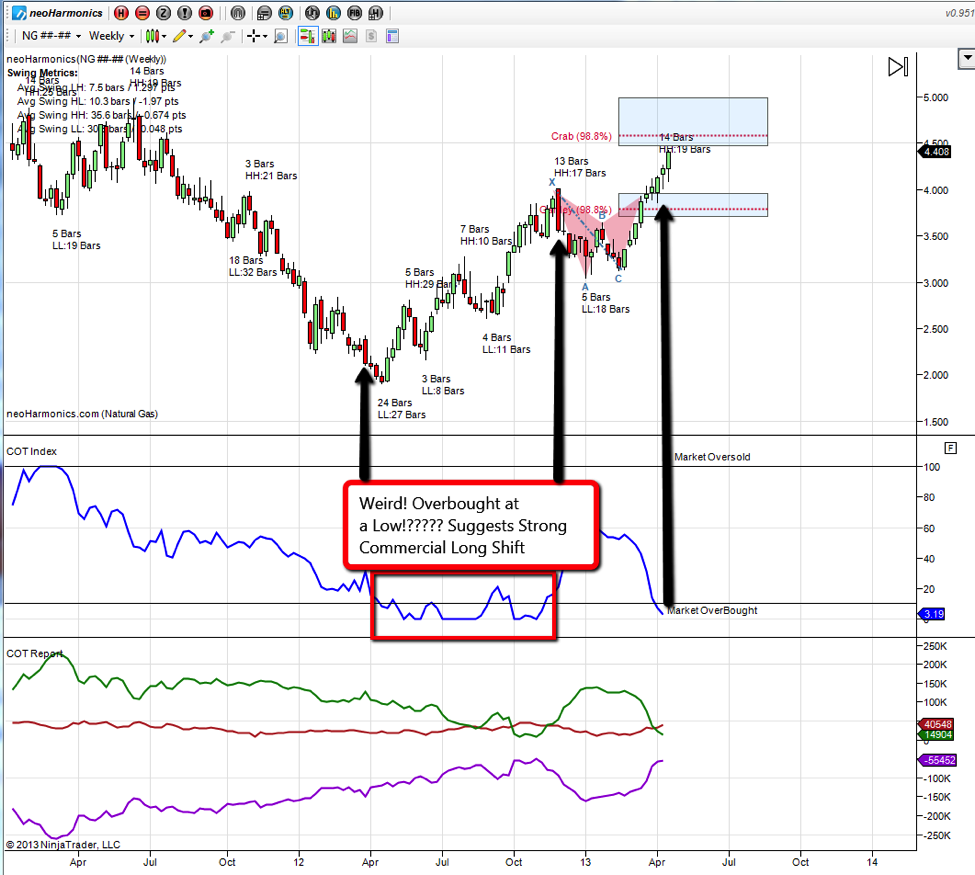
Natural Gas Chart with COT Report data
Disclaimer: This in no way constitutes investing advice. All of these opinions are my own and I am simply sharing them. I am not trying to convince anybody to do anything with their money. I am simply offering up ideas for the sake of discussion. As always, everybody is expected to do their own due diligence and to ultimately be comfortable with their own investing decisions. Any actions taken based on the views expressed in this blog are solely the responsibility of the user. In no event will Aether Analytics or its owner be liable for any decision made or action taken by you based upon the information and/or opinion provided in this blog.
Twitter: @InterestRateArb and @seeitmarket
Author is short Gold Putspreads, short NG Callspreads, short SPX Call & Put Spreads, short DX Call spreads at the time of publication.
Any opinions expressed herein are solely those of the author, and do not in any way represent the views or opinions of any other person or entity.


")


