Following Twitter’s (TWTR) earnings related train wreck, the stock still makes absolutely no sense on a valuation basis as it trades at 10x next 4 quarters EV/Revenues and 7.5x FY ’16 revenue estimates. That said, I recognize the buzz surrounding the potential for Twitter’s technology, so if one is inclined to get long it (as I am) waiting for a “reasonable” valuation may prove a waste of time.
It’s in these instances that I find DeMark indicators even more helpful than usual, because they try to identify at what point sellers are exhausted strictly from the standpoint of supply and demand of stock, without regard to valuation or fundamentals. So here are the daily and weekly stock charts for Twitter (TWTR):
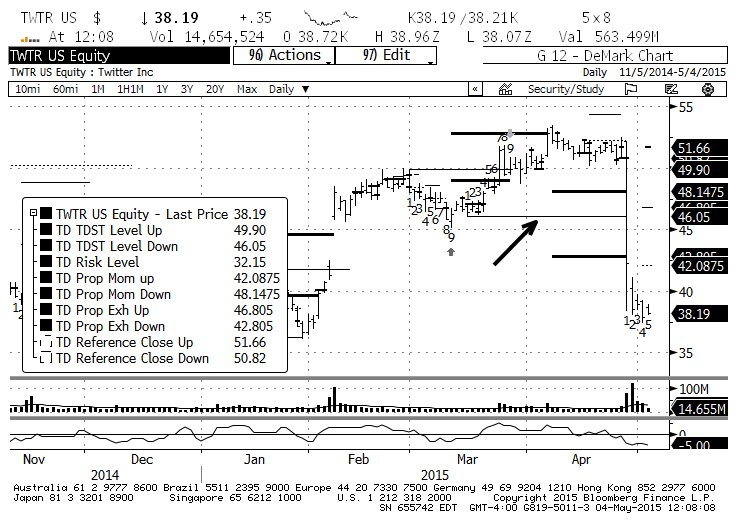
Twitter (TWTR) Daily Stock Chart
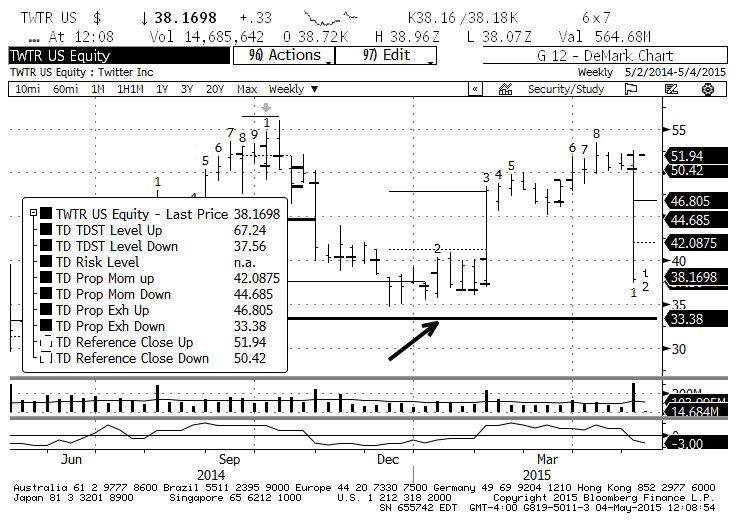
Twitter (TWTR) Weekly Stock Chart
The most important aspect of the daily chart is the break of the TDST Level Down (red solid line indicated by the arrow) on a “qualified” basis. The qualified break suggests that Twitter’s stock decline will continue until the TD Buy Setup count completes (i.e. 9 consecutive bars with closes lower than the close 4 bars prior), followed by completion of the TD Sequential Countdown Buy 13 (the Countdown count is calculated in a different and more complicated way which I won’t bore you with here). In short, on a daily basis there’s a high probability for more weakness over a protracted period of time.
How much more weakness? The weekly chart suggests at least down to $33.38, the target anticipated by the qualified TD Propulsion Exhaustion Down line (indicated by the arrow). Below that, TD Relative Retracement levels would sit at $31.87, $24.35, and $15.04.
How the various counts evolve will clarify how much lower Twitter’s stock may go, but based on what I see now I’m not interested in getting long until at least $33.38; and if/when the stock gets there, I’ll probably buy exposure through option “risk reversals”, which factor in the possibility of the lower prices identified by the TD Relative Retracement indicator.
Follow Fil on Twitter: @FZucchi
The author does not have a position in any of the mentioned securities at the time of publication. Any opinions expressed herein are solely those of the author, and do not in any way represent the views or opinions of any other person or entity.

 Rolling Over At Key Fibonacci Level?")


