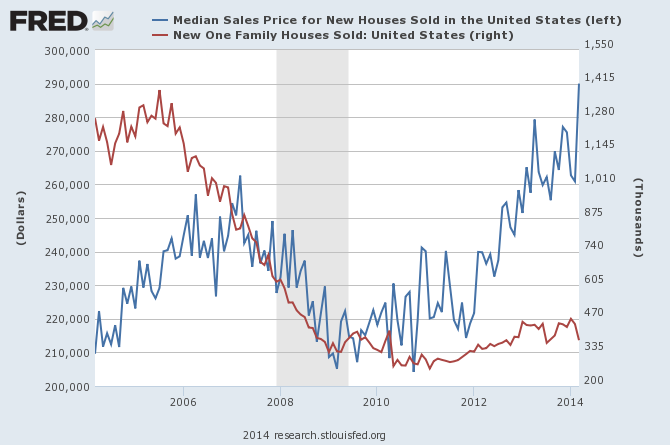
US median new home prices continue to rise and now exceed early 2007’s peak by over 10% (added in the last 2 months); but don’t look to New Home Sales for the catalyst.
Widely regarded as a leading economic indicator for the consumption ripple effect they create, 384k new homes moved in March, down from 449k in an acutely weather-stricken February (but wasn’t March seasonably mild?) and well below the 455k consensus forecast:
Against this backdrop, the US Homebuilder industry has held up relatively well. But there are now some (very consistent) technical signs in leading homebuilder stocks that suggest their almost unbelievable durability is at risk of buckling.
S&P Homebuilders (XHB)
As an industry, Homebuilder stocks overall (XHB) steadily advanced after Q4 2012’s low was put in near $24. A potential Ascending Triangle and/or Cup with Handle construction began building out in May 2013 after lending rates suffered their initial spike following Then-Fed Chairman Bernanke’s “next few meetings” remark regarding the timing of the Taper. Coming out of January 2014’s pullback, heavy rotation into Homebuilders sent XHB over horizontal resistance at $32.50-33; only to see that entire move fade in the 7 weeks since peaking near $34.
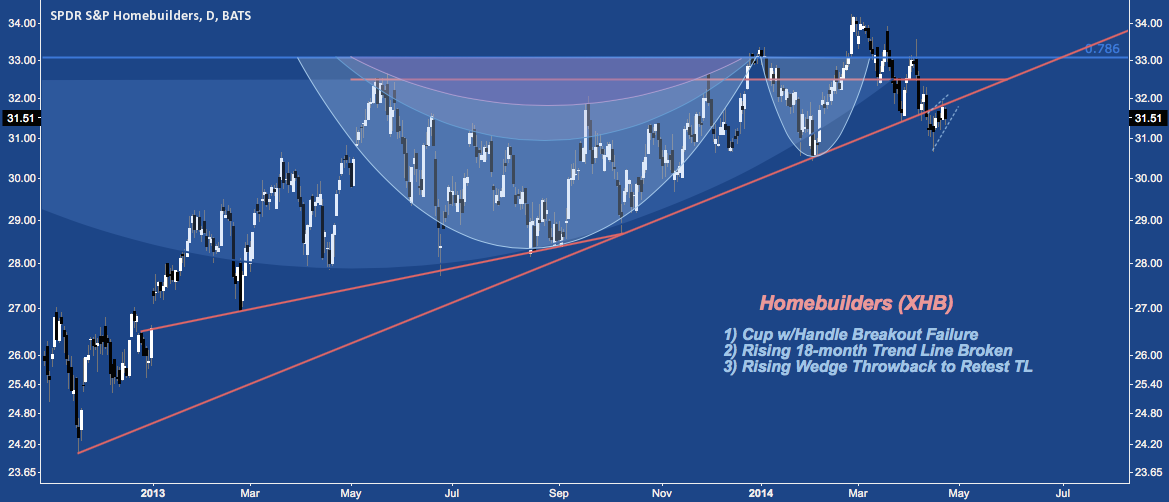
Earlier this month XHB gapped below the rising trend line that has served as support since November 2012. Now staging a throwback/return move over the last few sessions, whether price recovers or is rejected at the rising trend line will be of key importance.
The Ishares Home Construction ETF (ITB) lends support to thesis that XHB will resolve lower. ITB has set up a potential Double Top against the 50% retracement of it’s 2007-2009 range at $25 with a negative momentum divergence on it’s RSI and a Bollinger Band Bandwidth (BBW) that is historically compressed – to the same level form that prompted the streak from below $10 to $25 Between Q4 2011-Q1 2013. Volatility works both ways however, and below support near $20.50 there’s little to catch ITB until near $15.
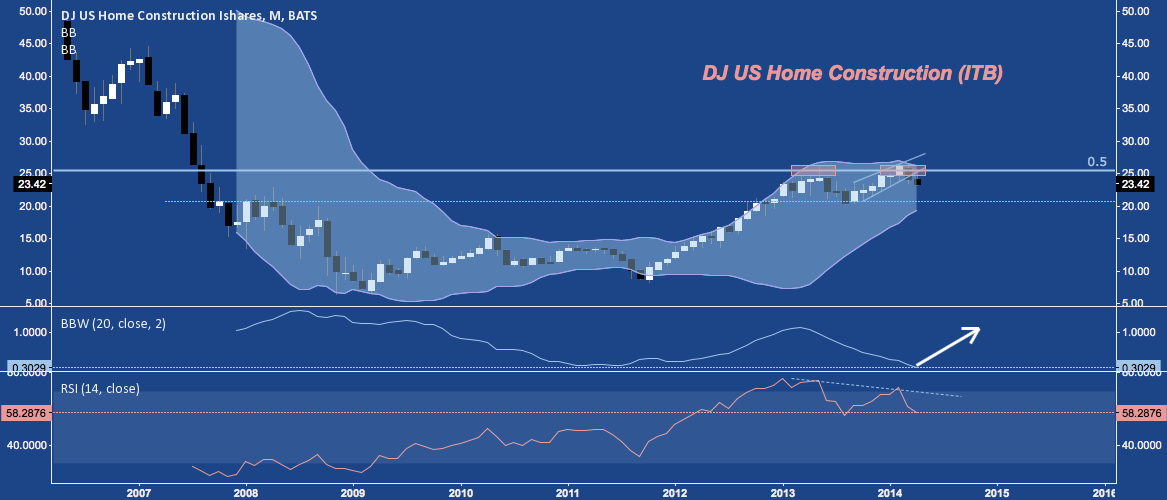
ITB‘s “Double Top at Key Fibonacci Resistance with Volatility Compression on Diverging RSI” setup is virtual rubric for the many of the leading US homebuilders:
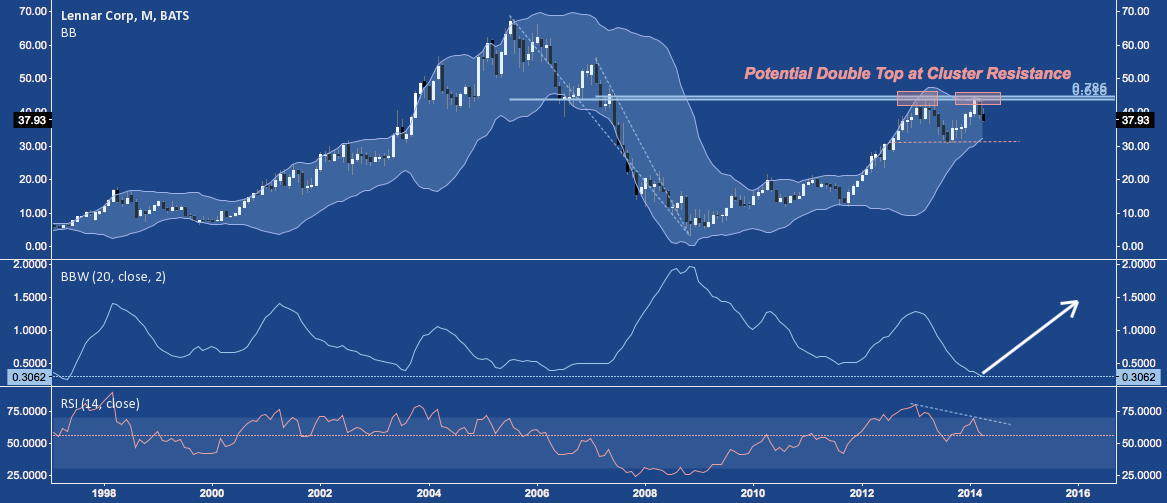
Lennar Corp (LEN) is representative with two touches at fibonacci cluster resistance near $45; and now half way to 2013’s major horizontal support near $31. A decline below this level has a lot of open air beneath it in virtue of 2011-2012’s unmitigated rise, suggesting a measured move down into 2010-2011’s congestion between $15-$20.
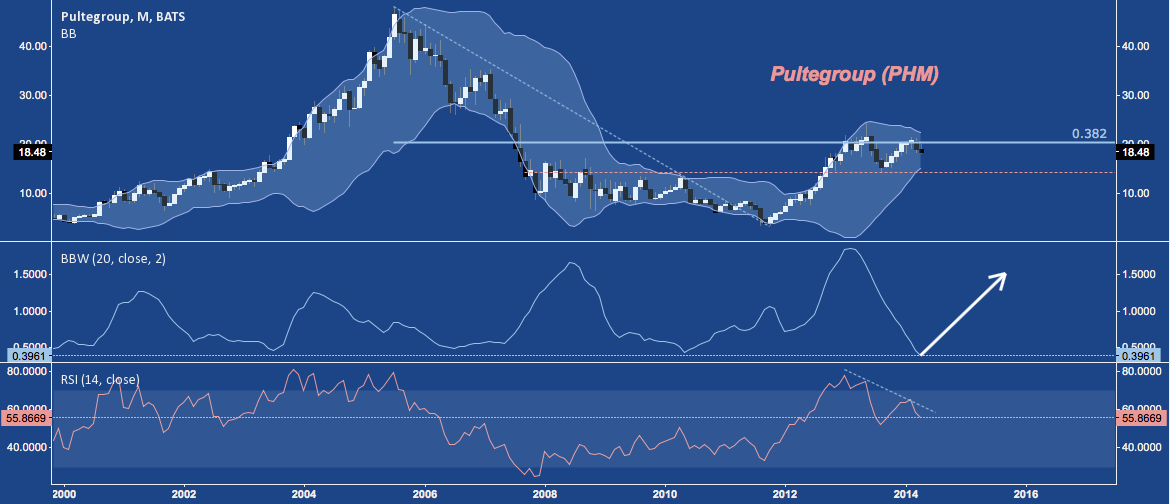
Pulte Group (PHM), which has solid horizontal support at 2013’s low near $14.50; but below which the double top activated on a break of that level suggests a measured drop to challenge 2011’s low.
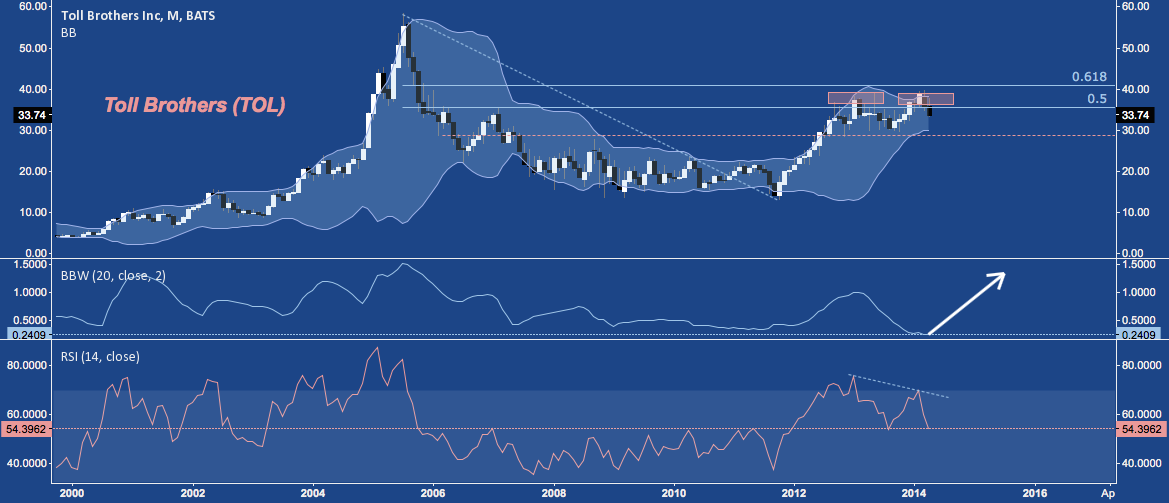
Toll Brothers (TOL) with horizontal support near $29.50; below the double top implies a drop into the 2007-2011 congestion between $15-$20.
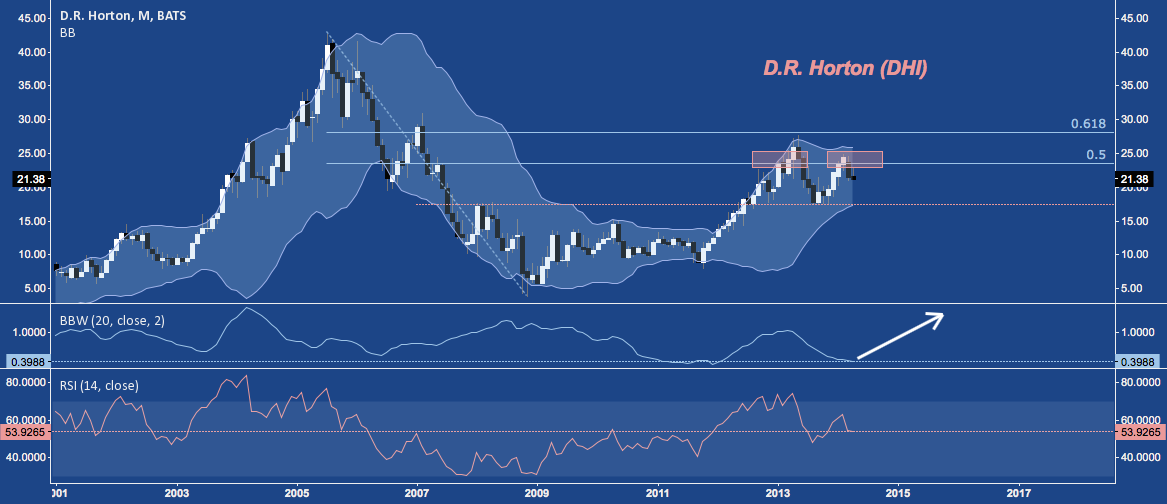
D.R. Horton (DHI) with horizontal support near $17 ahead of activating a double top that projects a measured move to below $10:
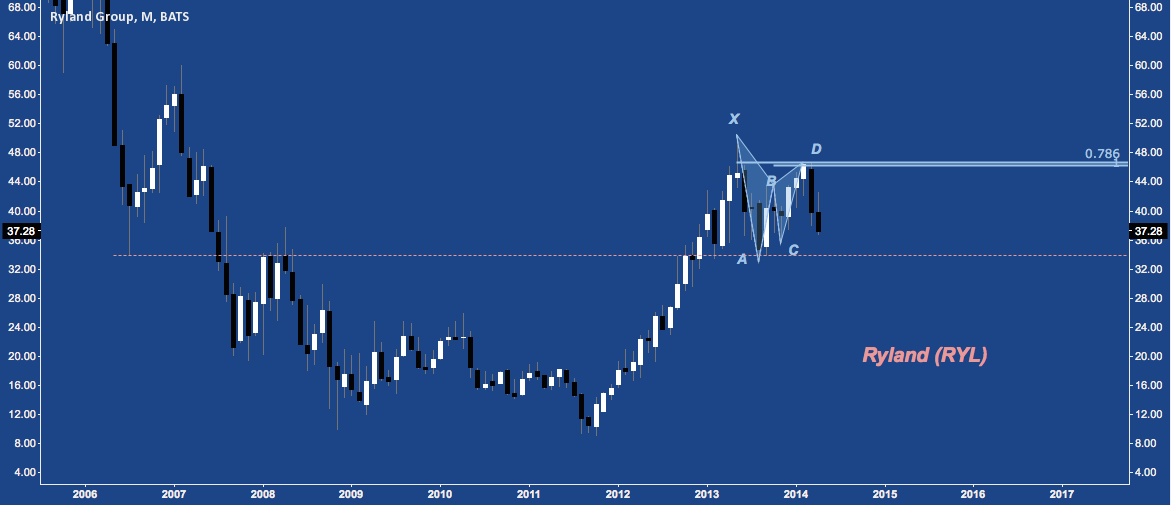
and Ryland Group (RYL) with it’s February top at Bearish Gartley resistance (point D) near $47 and support at C near $37 and A near $34.
Twitter: @andrewunknown and @seeitmarket
Author holds no position in securities mentioned at the time of publication. Commentary provided is for educational purposes only and in no way constitutes trading or investment advice.
Charts via FRED and Tradingview.com. “House” image courtesy https://healthyskinmakeupreviews.com
Any opinions expressed herein are solely those of the author, and do not in any way represent the views or opinions of any other person or entity.
 Rolling Over At Key Fibonacci Level?")


