Although the US economic recovery has been anything but vibrant, there are plenty of fundamental reasons to give for the recent strength in Home Depot’s stock price. Think lower gas prices, lower interest rates, stable housing, stable unemployment… and better earnings and growth. Even the most frugal will spend some money to update their house (especially if they are doing it themselves).
But I’m also a believer that the fundamentals show up in a stock’s price. So I wanted to share two Home Depot (HD) stock charts that explain Home Depot’s big run higher in price.
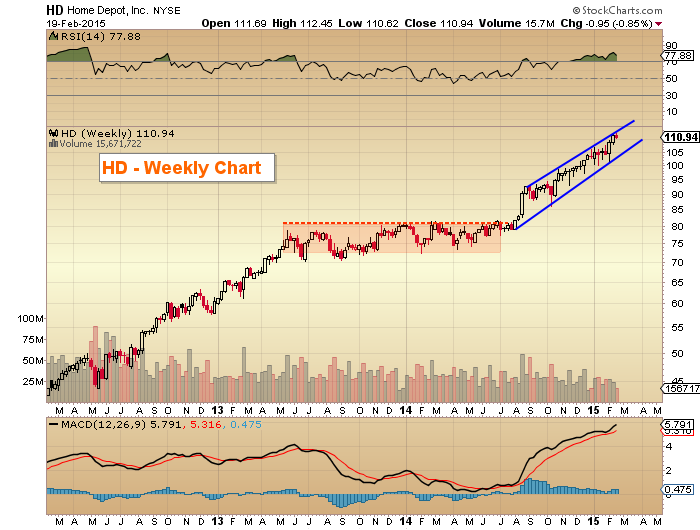
The first is a 3 year weekly chart. This is a macro look at the stock that highlights a major basing/consolidation period from May 2013 to July 2014. Home Depot’s breakout from this base is what set up the bullish channel to higher prices.
Home Depot (HD) Weekly Chart
The daily chart below gives a more focused look at the weeks leading up to the breakout, and magnifies just how powerful the move higher has been. As JC Parets wrote about last year, explosive moves often occur out of wide bases.
Home Depot (HD) Daily Chart
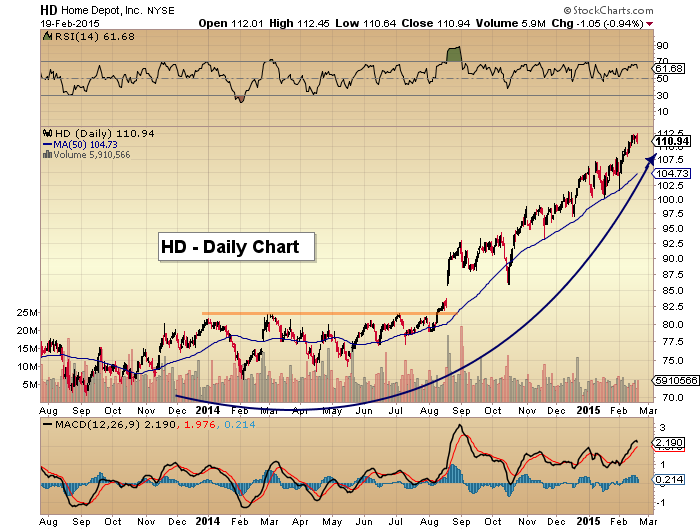
This is all hindsight and a bit educational. So let’s touch on the here and now. Home Depot’s stock is near the top of the weekly channel and momentum is beginning to wane. HD could use some time to breathe so consolidation may be in order soon. The 50 day moving average has been supportive so that is an initial support to monitor on any pullback.
Follow Andy on Twitter: @andrewnyquist
No position in any of the mentioned securities at the time of publication. Any opinions expressed herein are solely those of the author, and do not in any way represent the views or opinions of any other person or entity.

 Rolling Over At Key Fibonacci Level?")


