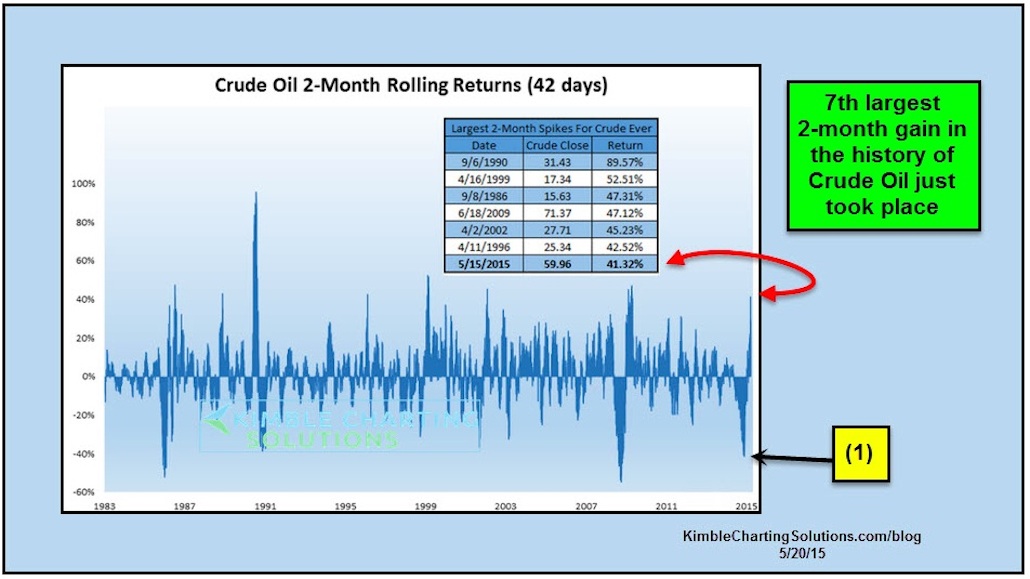
Just two months ago, the 2-month rolling return for Crude Oil prices was -40% (see point (1) in chart below). At that time, Crude Oil had declined almost $70 in the past 9 months, trading near $45/barrel. Many people were predicting that Crude Oil was not near a low and some were thinking the $20 range would come quickly.
Well look what happened. Crude Oil has gained 41% in the past 2 months, which is the 7th largest 2 month rally in its history.
Now let’s turn to another chart. The chart below may look familiar because I shared it here on See It Market back in late March. It showed that only 8 times in history had Crude oil created a 10 percent reversal pattern after a 40 percent decline in 12 months (and when this occurred, the average gain 12-months out was 50 percent).
At the time of that posts, Crude Oil had put in a monthly reversal candle (with a bullish wick measuring 10 percent) and it was also trading at long-term support. This provided a nice risk defined entry on the long side. (Again the chart below was from late March)
Something to consider, though: The average gain for Crude Oil after creating the bullish reversal pattern was 50 percent over the following 12-months. In the past 2-months, Crude Oil has gained 41 percent. Wow!
The bottom line is that bullish reversal wicks that occur at support levels can provide good entry points. After such a big rally, Crude Oil traders will likely need to be a bit more cautious (and savvy) going forward. Thanks for reading.
Twitter: @KimbleCharting
Author does not have a position in any mentioned securities at the time of publication. Any opinions expressed herein are solely those of the author, and do not in any way represent the views or opinions of any other person or entity.

 Rolling Over At Key Fibonacci Level?")


 Rolling Over At Key Fibonacci Level?")