The following was written by the Richardson GMP Asset Management Team.
An interesting thing happened this week, total oil production rose for just the third time this year. The +0.68% oil production increase was the largest increase since last October. It’s not all that surprising; it’s simple economics. Higher prices begets greater supply.
We’ve colloquially referred to this relationship as the “Ws”. Where oil prices will establish firmer upper and lower bounds and will trade within these newly established ranges. Rising oil supply will tilt the balance of the demand/supply dynamic and prices will likely fall in response. We’ve already begun to see this.
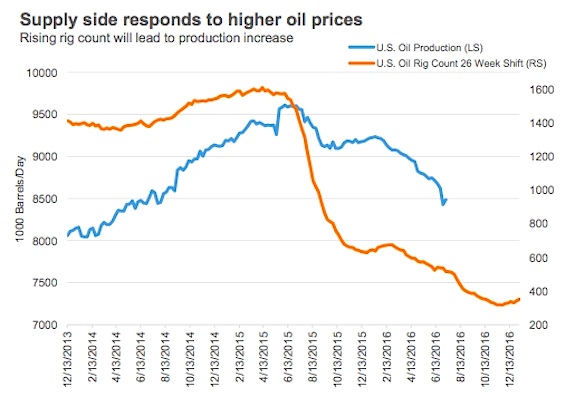
It’s the invisible hand at work. In our chart of the week, we’ve plotted U.S. oil rig counts which began to tick higher at the end of May, when crude approached $50/bbl. Over the past six weeks, the rig count has risen 10%.
To adjust for the delay between rig counts and oil production data we have shifted the rig counts ahead by 26 weeks, or half a year.
While the demand picture remains cloudy, there is the added complications of the Brexit event. Credit Suisse for example is now expecting below trend oil demand growth in 2017. Coupled with what we expect to a delayed positive supply side increase in production growth led by U.S. shale.
Noted above the price recovery is faltering, not surprising given the 100% increase from February to early June. It’s only been one data point, a blip on the chart, but the sharp oil production growth slowdown has likely abated, and with that the most positive impetus for higher oil prices has been removed. Also don’t forget about the continued draw from elevated inventory levels. It’s not our phrase, but it looks like darker clouds are coming. If you’ve missed the energy uptick we would express caution in jumping in just yet. No one knows where this pullback will end but it’s worth devising a plan with a couple of staged entry points as we wait for yet another ‘W’.
Charts are sourced to Bloomberg unless otherwise noted. Read more at Richardson GMP.
Twitter: @sobata416 @ConnectedWealth
Any opinions expressed herein are solely those of the authors, and do not in any way represent the views or opinions of any other person or entity.


