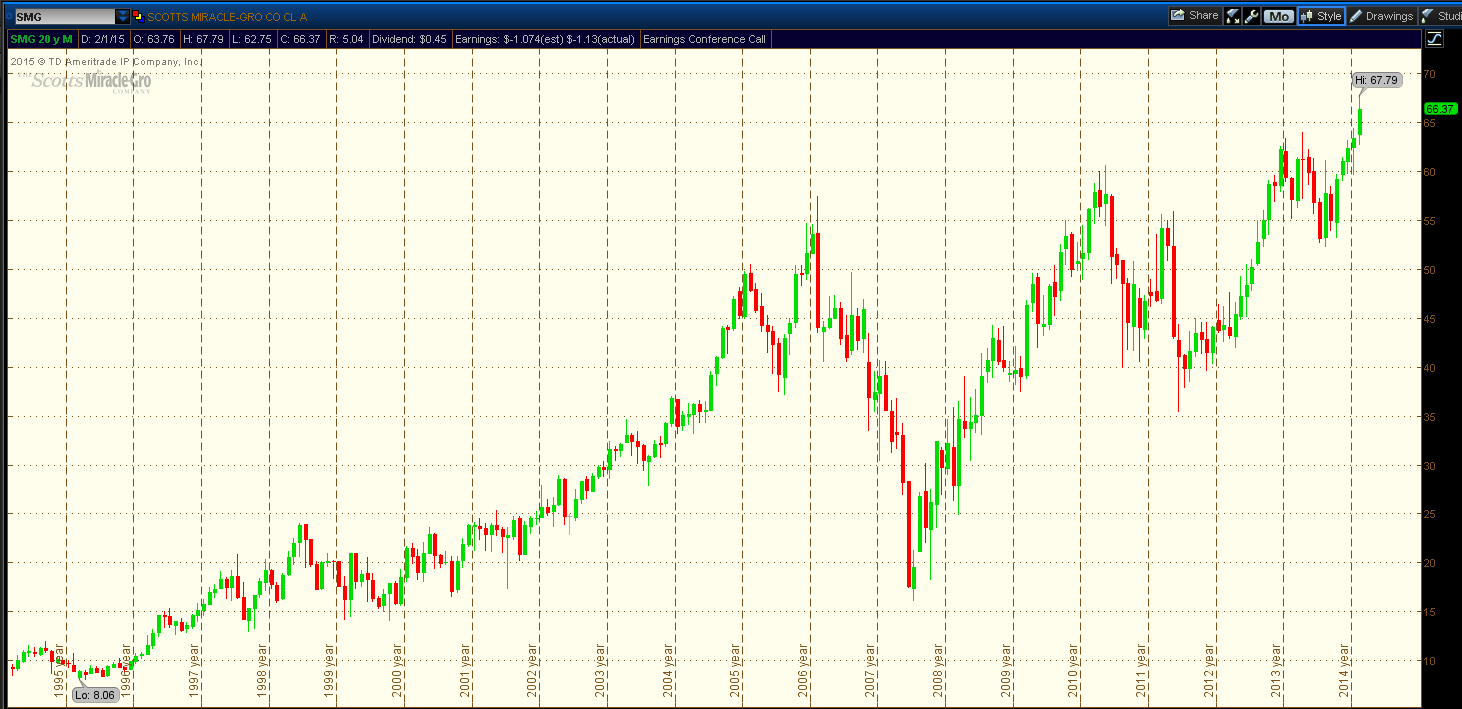
There is record snow pack in the Boston area and much of the nation is going to feel sub-freezing temperatures this week. Not exactly the best time to consider revamping your garden. Last year’s visit from the Polar Vortex hurt the fundamentals of Scotts Miracle Gro (SMG), but the company was able to recover nicely in the late spring through the balance of the year. The stock now sits at all-time highs.
Scotts Miracle Gro (SMG) Long-Term Stock Chart
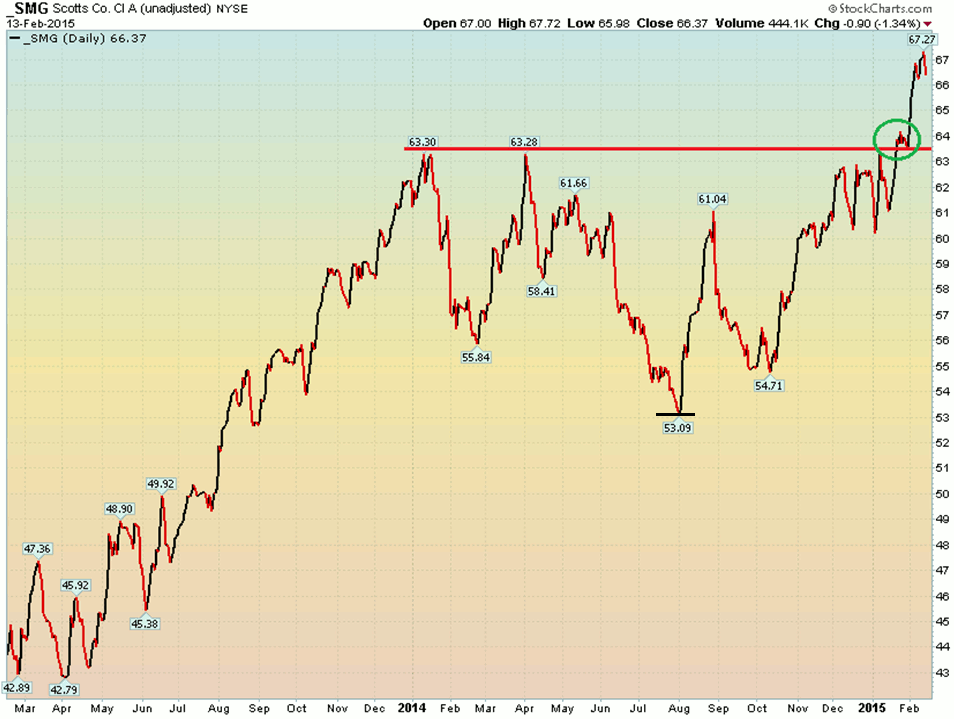
Turning to the near-term chart of Scotts Miracle Gro, we see what had been clear resistance at the $63.30 level. The stock recently broke above this resistance, triggering a bullish breakout price objective of about $73.50. The price objective is computed by subtracting the summer 2014 low from the resistance point; that difference is then added to the resistance point. Putting that into numbers: 63.3-53.09=10.21 +63.3=73.51. It is important not to get bogged down to a precise number, but to simply know about the area at which you would want to sell based on the magnitude of the breakout.
Scotts Miracle Gro (SMG) Near-Term Chart
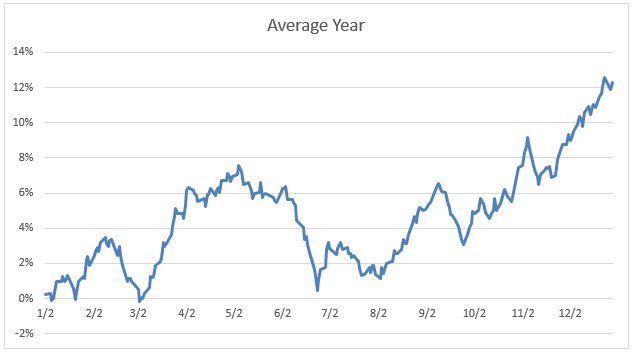
SMG makes most of their money when people are buying lawn and garden products, so their business is quite seasonal. It is helpful to look at the seasonality of the stock performance considering the fundamental seasonality. In the below ‘average year’ chart, you will notice a pop in Scotts Miracle Gro’s performance from early March through early May. More than half of the stock’s annual gain comes during this two month stretch, on average.
SMG Seasonal Stock Trends
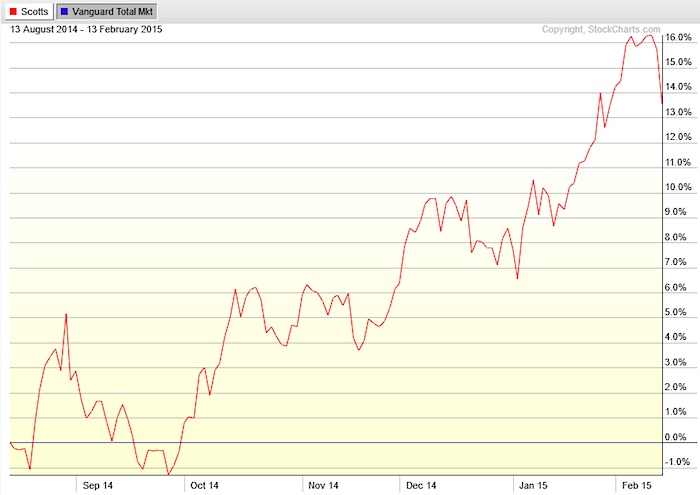
I always like to see how a stock is performing relative to the US stock market as a whole. The below chart highlights the strong performance and momentum of Scotts Miracle Gro (SMG) versus the Vanguard Total US Stock Market Index ETF (VTI). SMG took a bit of a hit over the past few days, but this weakness may be setting up for a strong March 1 through May 1 period once again.
Scotts Miracle Gro (SMG) Relative Strength Chart
Thanks for reading.
Follow Mike on Twitter: @MikeZaccardi
No position in any of the mentioned securities at the time of publication. Any opinions expressed herein are solely those of the author, and do not in any way represent the views or opinions of any other person or entity.


