Unlike an Apple’s quarterly revenue miss or a hedge fund activist tussle with a struggling multi-national corporation, business coverage on one of the world’s most important crops, soybeans, tends to be neglected in favor of a tech IPO or predictions of the next Fed Funds rate hike. Developments in the agricultural markets in recent weeks are putting the spotlight on commodities like soybeans. Moreover, a soybeans breakout appears to be in action.
Flooding and heavy rains in Argentina this spring will mean lower outputs from South America this year. Another fundamental factor that could take place this month is possibility that the USDA increases their export projections due to strong foreign demand across the globe.
Finally, from a currency standpoint, a weakening U.S. dollar (down nearly 5% year to date) is a tailwind not just for soybeans, but oil, gold, silver, etc. To put it simply, a weak dollar means it takes more dollars to buy soybeans and visa versa.
Below I’ll take a look at long and intermediate-term technical and key levels on soybeans to watch going forward. Keep an eye on that soybeans breakout pattern.
- The 20-year monthly chart shows a long-term uptrend line dating back to 2002; buyers now stepping in at key support following a 52% crash from the 2012 highs.
- MACD is confirming the bullish price action with a crossover earlier this year. This could propel soybeans prices higher.
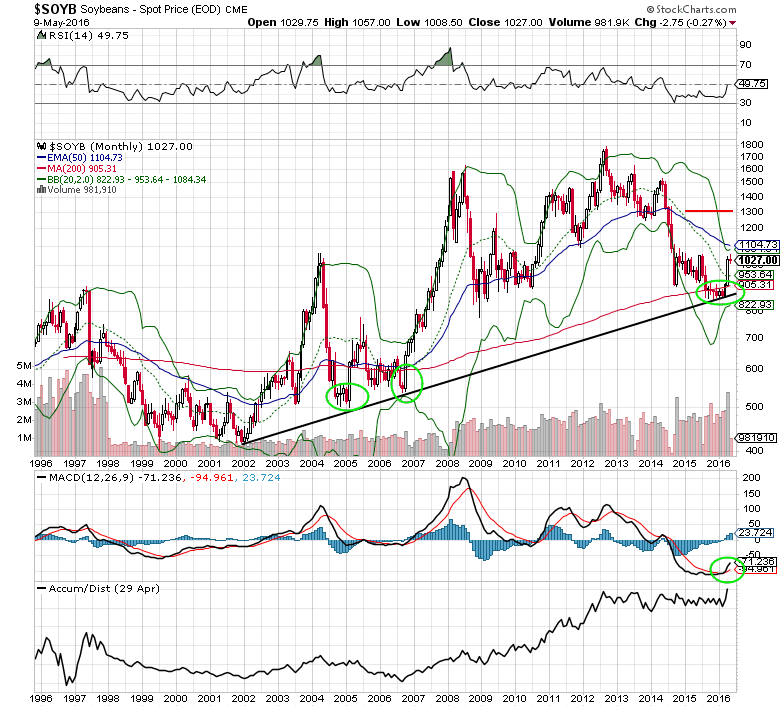
For investors with a longer-term time frame (several months to more than a year) a stop loss can be placed under the $8.44 per bushel level (spot price) to contain risk in the event of another correction. Soybeans may return to the $17-$18 per bushel range, but a more realistic target for 2016 is near the 50% retracement at $13.16 (mid-point of 2012 highs and 2015 lows).
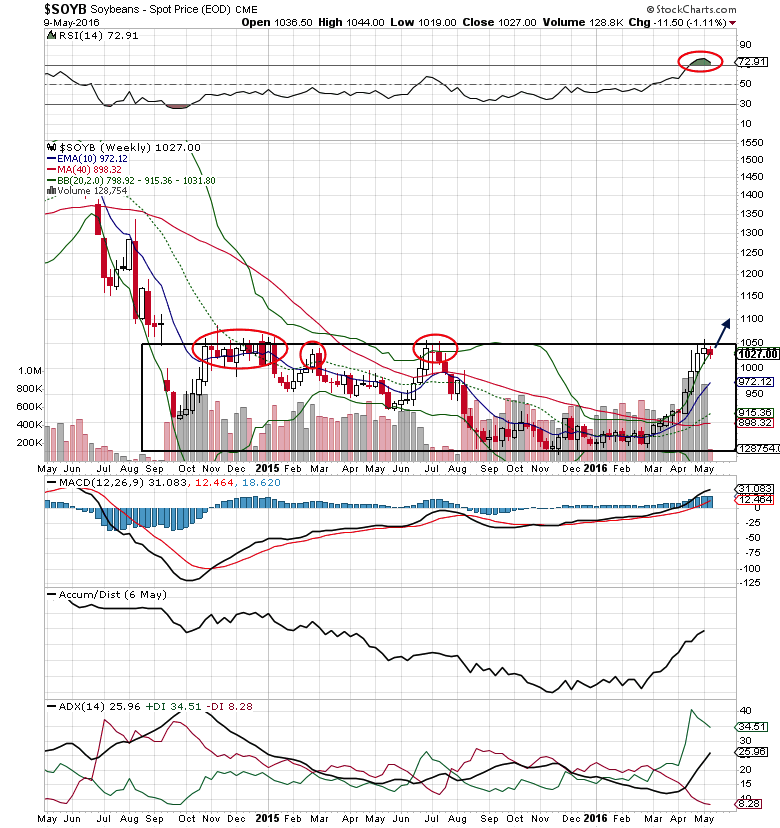
- Since late 2014, beans have been stuck between $8.44 and $10.50; now trading at the top of the range (and poking through)
- RSI is at its highest level in more than 2 years (overbought on a relative basis)
- A close above $10.50 positions for a soybeans breakout and a measured move north of $12.50 per bushel.
Thanks for reading and good luck out there!
Twitter: @MitchellKWarren
The author does not hold a position in mentioned securities at the time of publication. Any opinions expressed herein are solely those of the author, and do not in any way represent the views or opinions of any other person or entity.


