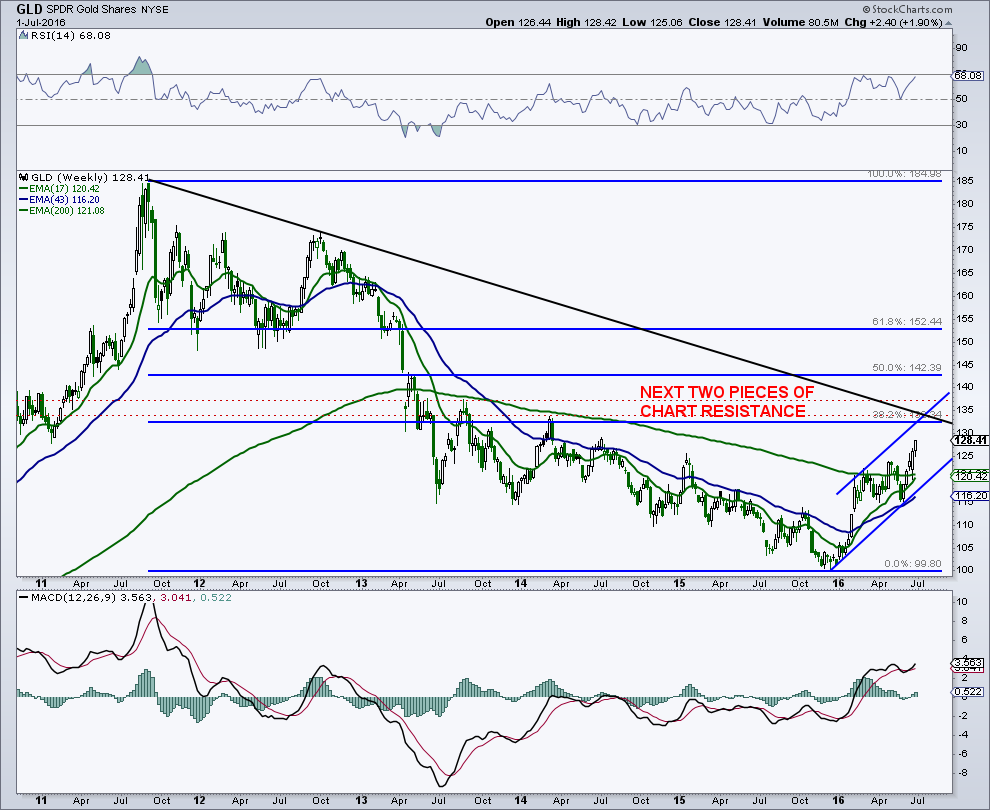
Gold prices have surged higher in recent weeks pushing the 2016 gold rally toward 3 year highs. Although the weekly SPDR Gold Shares (NYSE:GLD) chart looks to have some more room on the upside, it will soon encounter resistance.
The yellow metal faces a myriad of potential resistance up in the 132 to 138 area.
It is generally wise to pay attention to regions on the chart that have multiple pieces of support or resistance. In this $132 to $138 zone on GLD (the gold ETF), there are multiple pieces of trendline resistance, multiple pieces of chart resistance, as well as a key FIBO retracement target.
Lastly, weekly momentum (14W RSI) is approaching overbought territory.
SPDR Gold Shares (NYSE:GLD) – Weekly Chart
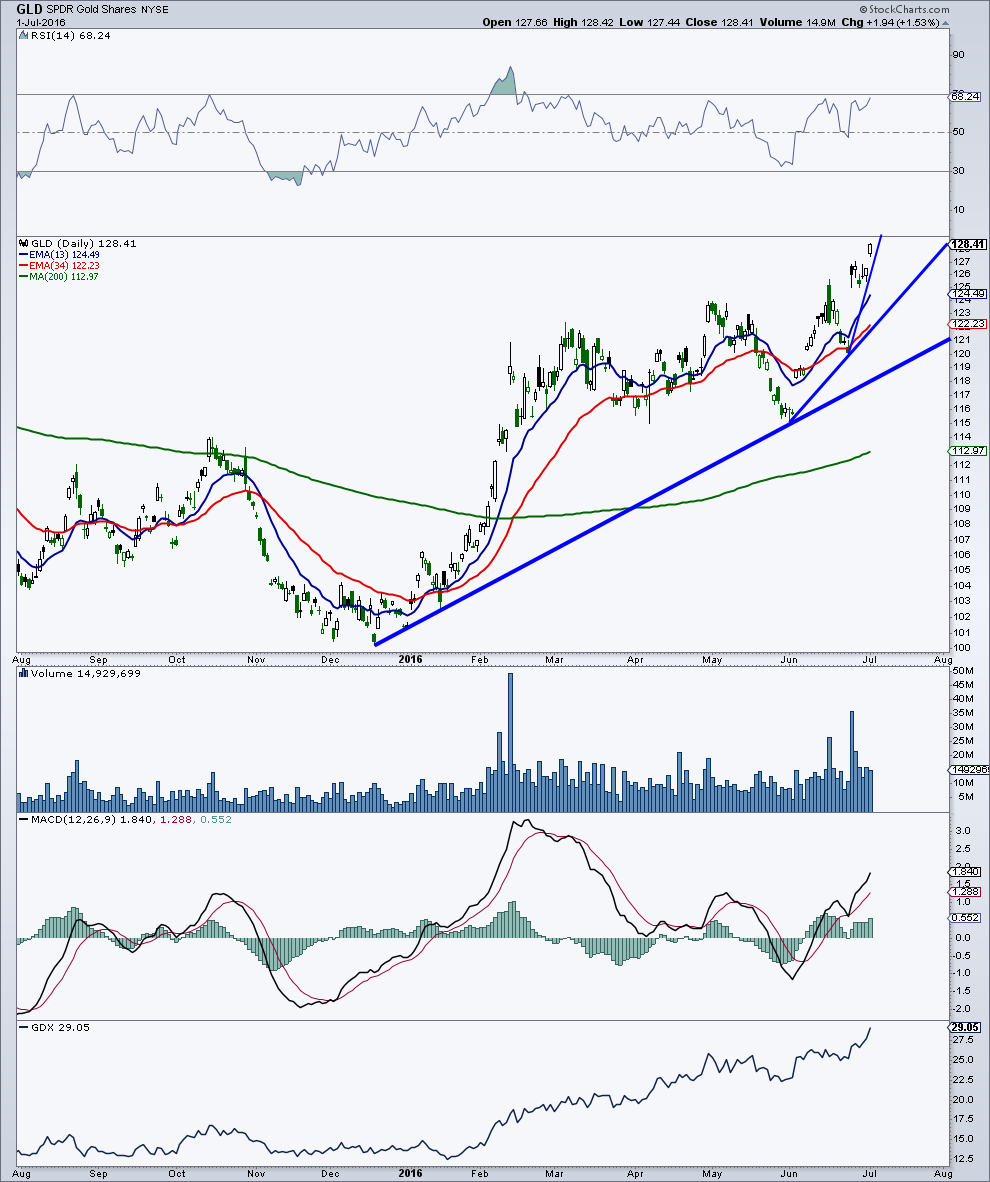
On the daily chart, a measured move based on the size of the recent consolidation could see the gold rally target the 133 level near-term. Note that this is within the area I talked about above. The slope of the advance has gotten rather steep, and therefore, is unsustainable. And daily momentum (14D RSI) is also approaching overbought territory.
I will note that gold is one of those assets that can really stretch the typical overbought and oversold RSI readings of 30 and 70 so its probably more appropriate to use 25 and 75. I would also note that gold prices are pretty stretched from the 200-day simple average. This is a sign of a heated market in need of an eventual pullback and rest.
SPDR Gold Shares (NYSE:GLD) – Daily Chart
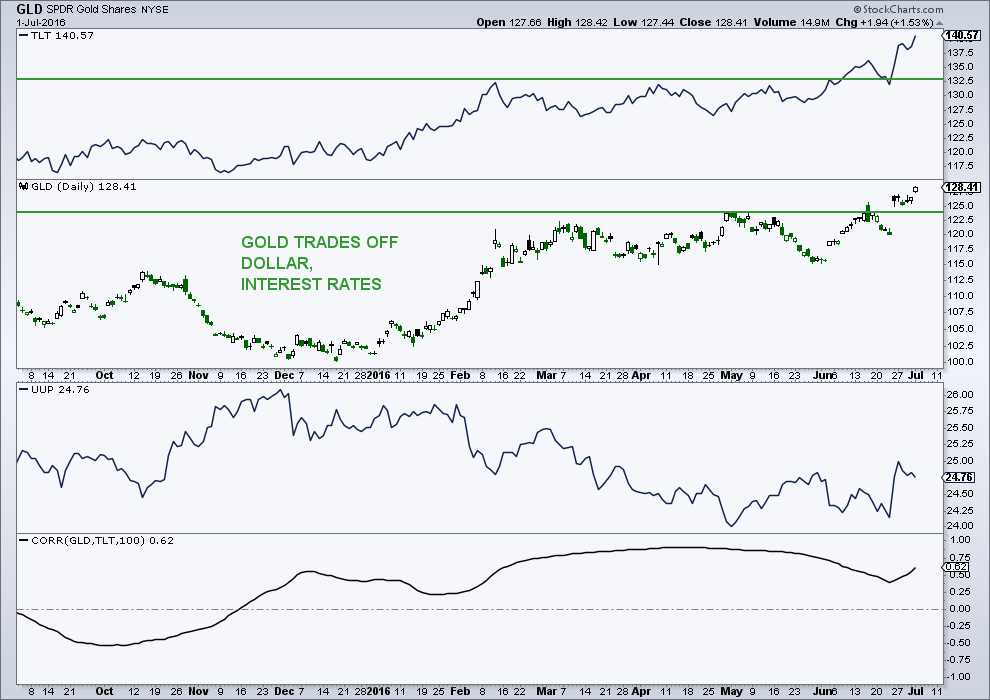
This next chart tells the story of the 2016 gold rally as it pertains to Treasury prices (TLT) and the U.S. Dollar Index (UUP) as well as GLD’s correlation with TLT.
As you can see, Gold prices (seen here as the Gold ETF – GLD) are quite sensitive to treasury yields and movements in the greenback. Lower U.S. dollar = higher gold prices. Higher treasury bond prices (lower yields = lower carrying costs) equates to higher gold prices.
It certainly appears that the latest GLD breakout has more to do with lower yields and less to do with the U.S. Dollar Index. The correlation between GLD & TLT has been pretty high since late last year. With my belief that Treasury prices are stretched and due for a pullback, Gold (and GLD) might not be far behind.
I have been worried about the large (now record) short position in the gold futures market by the so-called smart money commercial hedgers. So far, the commercials have been wrong. At the same time, large speculators (hedge funds) are now sitting with a record long position in gold futures.
In my work, something is going to give, potentially over the next couple of weeks to month, to reconcile these polar opposite positions.
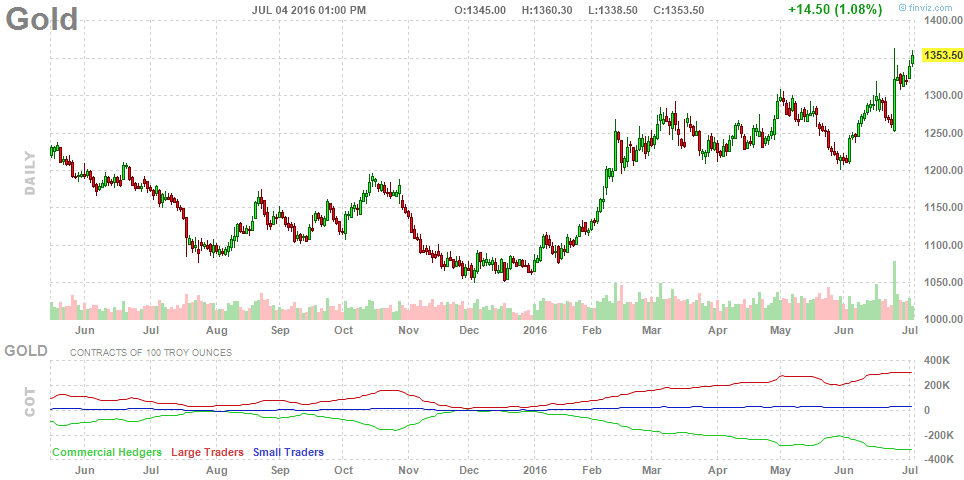
Conclusion: While the 2016 gold rally has more room on the upside in the short-term, there are certainly risks (Treasuries reversal, COT data). So a pullback in gold may not be too far behind.
Thanks for reading and best of luck out there. You can contact me at arbetermark@gmail.com for premium newsletter inquiries.
More from Mark: 3 Reasons Why Market Pullbacks Are Bullish
Twitter: @MarkArbeter
The author may have positions in mentioned securities at the time of publication. Any opinions expressed herein are solely those of the author, and do not in any way represent the views or opinions of any other person or entity.


")

 Rolling Over At Key Fibonacci Level?")
")
