After the huge bull market that ended in 2011, Gold prices have done nothing but wring optimism out of Gold bugs at every turn. As many investors are aware, Gold has been a falling asset for the past 4 years.
In previous posts, I’ve mentioned a certain price level for Gold futures many times: 1179.4.
1179.4 was the low on June 28th, 2013 and a level that gold futures tested on both sides many times in 2014 & 2015. However that level sustained a significant breach this past summer. And in late October 2015 that level marked the unwinding of any bullish case one could currently make for gold, as a retest rally failed and sent gold tumbling towards its multi-year target of 1033.4. I wrote about this gold price target back in 2013 and Gold is now clearly within striking distance.
So, how did I derive a target that far out ? Using a proprietary Fibonacci method I co-developed several years ago, which I like to call “One shot, One kill,” I identified what I determined to be two swing levels that would yield a long term target as well as 2 resistance levels that were never tested.
Not being able to test even the first resistance level was one of many clues that gold futures were no longer a “flight to safety.” I saw several so-called gold experts calling for gold prices anywhere from $2500 to $10,000 an ounce. Obviously they were trading their heart and not the chart.
As you can see in the 4 year daily chart below, swing point 1 was 1798.1, the high for gold prices on October 5th, 2012. Swing point 2 was identified at 1179.4, the low on June 28th, 2013. And here we are nearly 2 1/2 years later and less than $23 from the long-term gold price target.
Gold Futures – 4 Year, Daily Chart
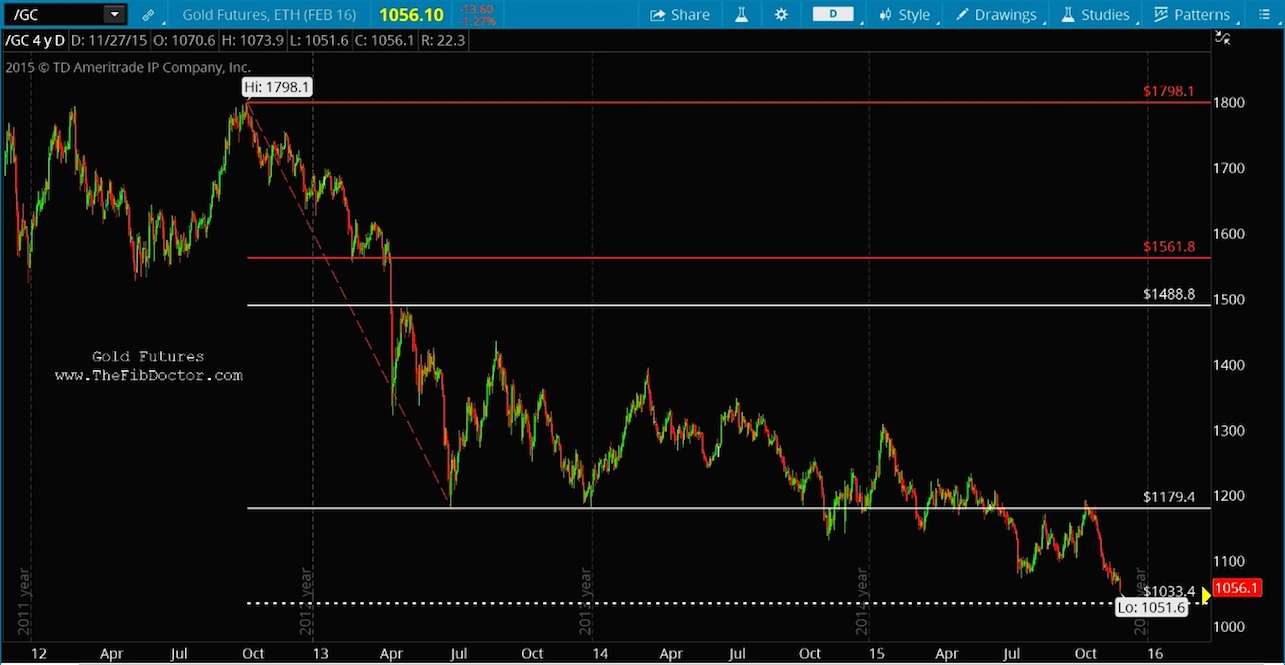
So, where does gold go from here ? I fully expect the price target to be hit and will likely provide some support, but very likely temporary support.
Until the 1033.4 target is closed, I can’t derive a new downside target but I’ll leave you with this final chart to ponder on (Hint: It doesn’t look good for gold bulls & bugs over the intermediate term)
Gold Futures – 10 Year, Weekly Chart
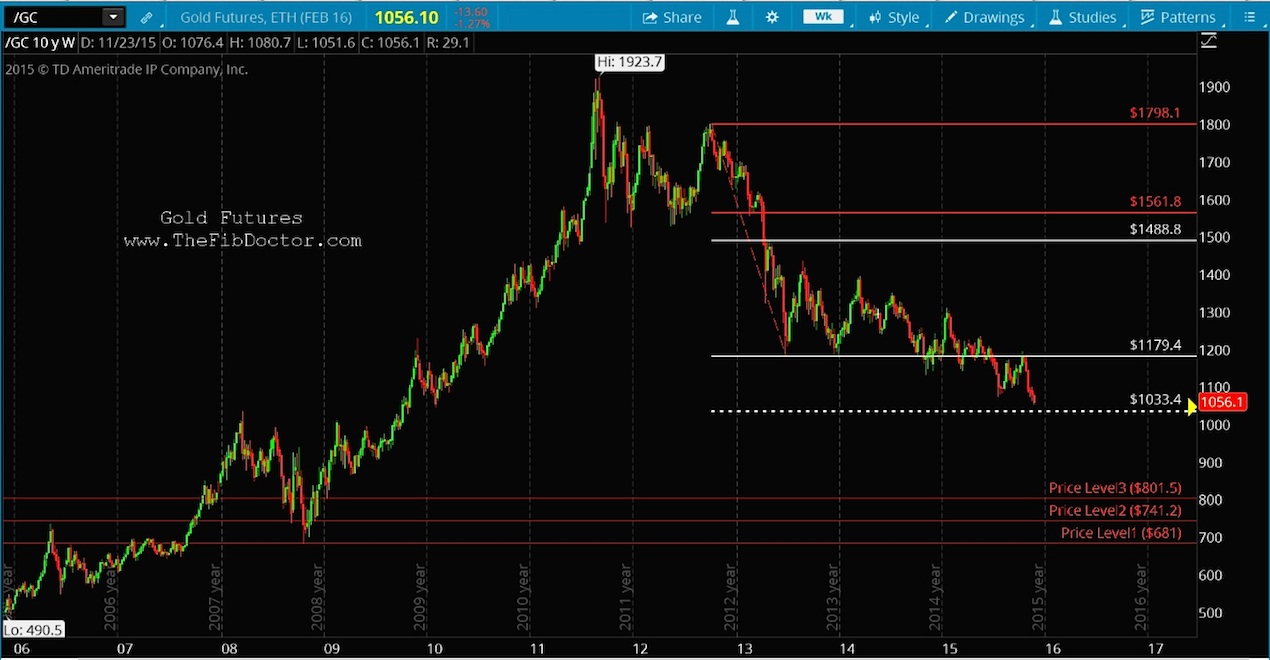
It’s also worthy to note that “half-way back” has been broken on the 10 year chart. Ironically, a secondary Fibonacci level that could lend some support is only $4.60 above the 1033.4 target.
Thanks for reading and always trade the charts, not your heart!
Read more from David: “US Stock Market Indices Showing Strength“
Twitter: @TheFibDoctor
No position in any of the mentioned securities at the time of publication. Any opinions expressed herein are solely those of the author, and do not in any way represent the views or opinions of any other person or entity.


