Gold prices experienced a brief respite in January, retracing roughly 38.2 percent of its 3 month losses. But in doing so, two things are important to note: 1) the Gold Miners (GDX) did not bounce with Gold (GLD) and 2) both are now under pressure again and nearing critical technical support.
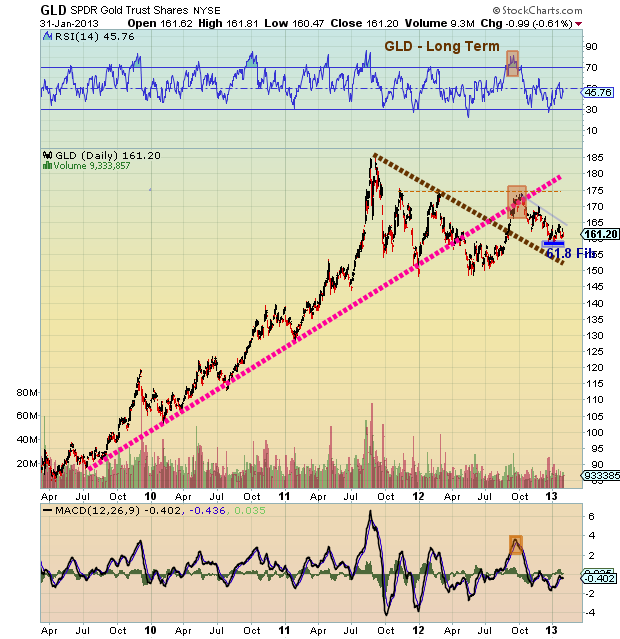
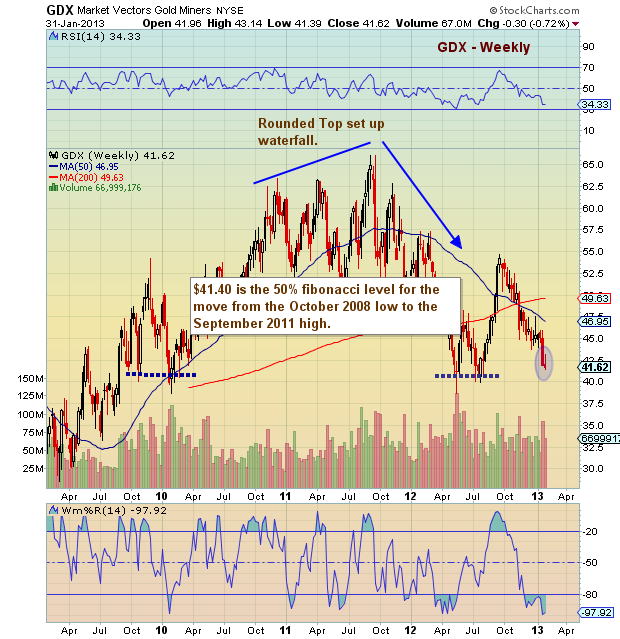
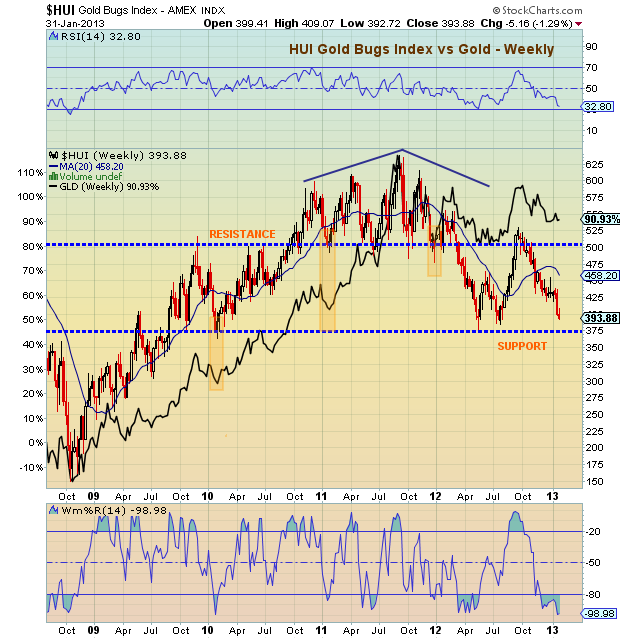
Below are a series of charts that highlight the importance of Gold’s macro 61.8 percent Fibonacci retracement level around $158 (using GLD) and the macro 50 percent Fibonacci retracement level around $40 for GDX. Note that the last chart showing the Gold Bugs Index (HUI) compared to GLD shows that it is also nearing important technical support. And finally, after leading Gold prices higher for years, the Gold Bugs index has been leading prices lower for the past year. And this has kept the complex “heavy.”
The character of the price action around these critical technical support levels should be telling.
Trade safe, trade disciplined.
Gold – GLD Technical Support Long-Term Chart
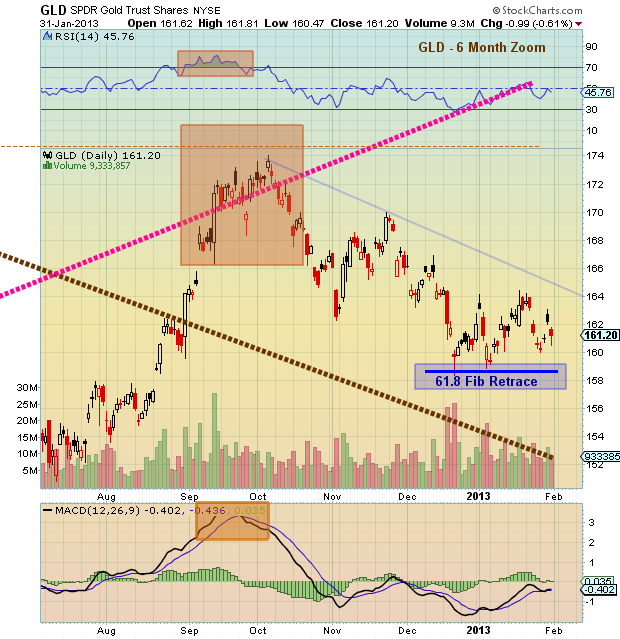
Gold – GLD Technical Support Zoom Chart
Gold Miners – GDX Technical Support Long-Term Chart
Gold Bugs Index – HUI Technical Support Long-Term Chart
Twitter: @andrewnyquist and @seeitmarket
No position in any of the mentioned securities at the time of publication.
: Worrisome to Broader Market?")

: Important Breakout Retest")
