There have been several global macro crosscurrents over the past several weeks that have highlighted the financial markets uncertainty. In 2015, investors have seen Gold rise with a stronger. And Bonds are higher, while equities are near par. What’s going on behind the scenes? Can we glean any more information from other global macro indicators?
It’s time to take a quick spin around the financial markets to see where capital is flowing, why, and what’s on tap for this week. Let’s get right to it.
Macro Themes
Looking at the capital asset markets over the near-term, it’s clear that there is some uncertainty as participants sort out the global landscape. Will the ECBs new bond buying program stimulate growth in the region? And perhaps an even more important question: Will the ECBs program cause further dissension in the European Union as politics and human interests collide? See my recent post on Sunday’s Greek Election.
Concerns over Europe’s situation have spilled over to the global markets, as investors begin to wonder about deflation. But this concern has pushed investors into both bonds and equities. Let me explain.
Bonds: The Long Bond has been outperforming equities over the near-term. Moving to bonds is often referred to as a flight to quality (or safety). And it usually accompanies a stock market correction. As of now, it’s simply accompanying stock market volatility/uncertainty. With the Euro Zone on edge and Crude Oil down 60 percent since last summer, many investors feel bonds are the safe route. It’s also quite possible that a bond bubble may be forming. You can see similar low/zero/negative interest rates in Europe.
Here’s a 3 month chart of bond prices vs the S&P 500:
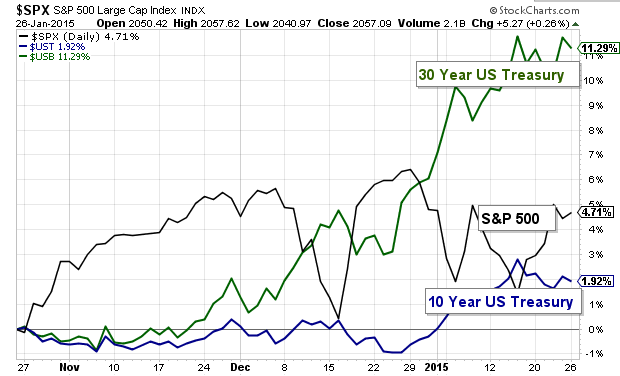
Equities: This brings us to equities. In the chart above, you can see that the S&P 500 has been quite choppy over the past 3 months. And if you expand it to the past 5 months (capturing the October correction), it’s even choppier. But, equities are also holding up fairly well here, all things considered. Below is a YTD performance chart of the major world share markets: S&P 500, German DAX, Japan Nikkei, and Shanghai Composite. Notice that international markets are outperforming. A stronger US Dollar may be assisting other countries efforts to stimulate growth… and global yields remain low.
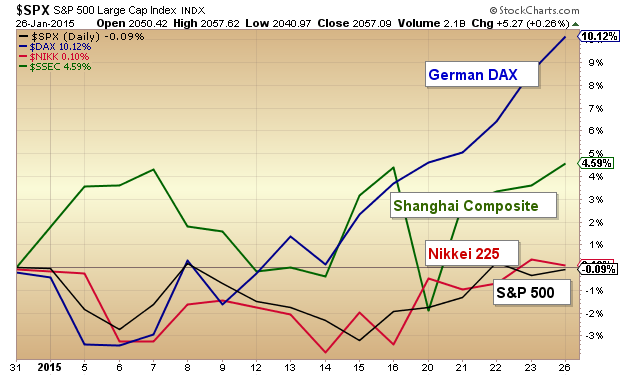
The German DAX has jumped higher, perhaps into the ECB’s big announcement. And the Chinese equities markets have been very strong. But the US equity market continues to chop. And that may be with us for a little while longer, as global macro indicators currently favor international stocks.
News & Economics
- The Greek Elections (along with the NFL’s “deflate-gate” have dominated the news cycle. Here’s one of many articles(from WSJ).
- This week is a BIG week for US economic data:
- TUESDAY: Durable Goods, Consumer Confidence, New Home Sales
- WEDNESDAY: FOMC Fed Statement
- THURSDAY: Initial Job claims, pending home sales
- FRIDAY: Q4 GDP, Michigan Consumer Sentiment
The Week Ahead
We will likely continue to see more focus on the Euro. The Euro dropped to 1.1099 Sunday night on the Greek election results but has rallied back over 1.12 since. Stability in the Euro would go a long ways to adding some stability near-term to the markets. As mentioned above, the US markets will receive a fresh influx of data this week. AND, it’s Fed week… will the Fed offer any new insights into their views on the economy and rates?
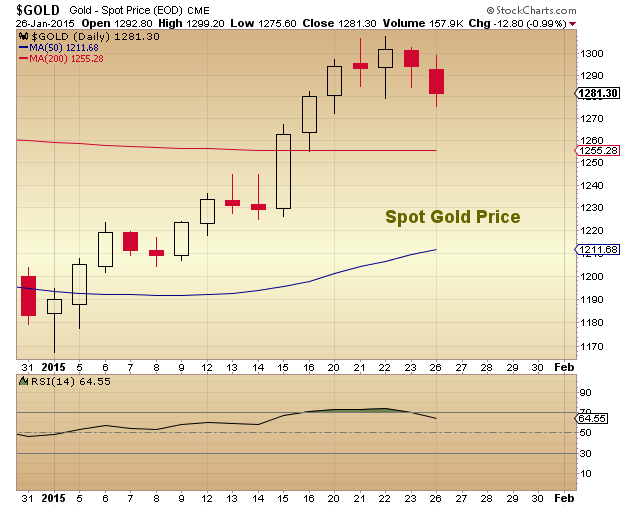
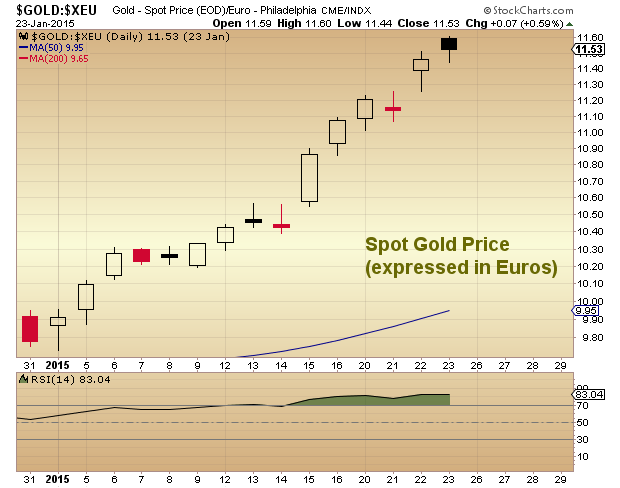
One popular asset class to discuss is Gold. Every has an opinion on Gold, and perhaps this week will be important for Gold as well. Gold has risen into the new year (especially when valued in Euros). I believe much of this has to do with currency/European Union fears (more so than inflationists). So the European storyline will have to be watched here.
Spot Gold Prices
Spot Gold Prices (expressed in Euros)
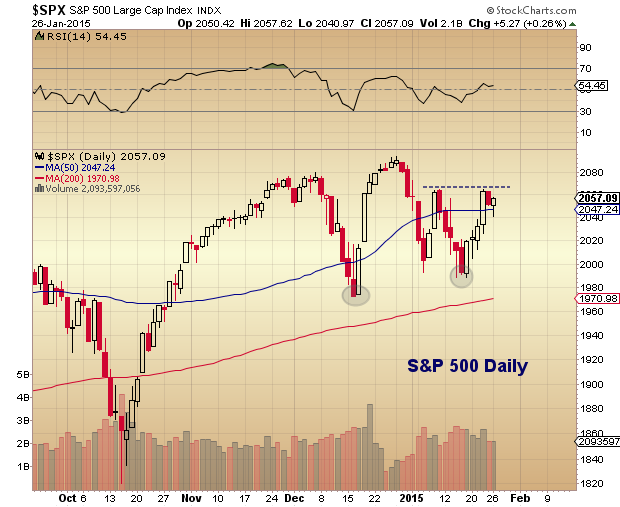
Moving on to US Equities… Below is a chart of the S&P 500 highlighting just how choppy it’s been for traders and investors over the past 5 months. Yet we are just a little over 2 percent off all-time highs.
Last week, the S&P 500 closed just above its 50 day moving average. It is important to remain above the January 16 lows (1988.12), and even more important to hold the December lows (1972.56).
There is lateral overhead resistance at last week’s highs (2064.62) and the January 9 highs (2064.43). A break above this level would likely signal a retest of the all-time highs.
S&P 500 Daily Chart
Invest with discipline and have a great week.
This post went out to our email subscribers as part of our “Market Navigator” newsletter (subscribe here, it’s free). The aim of the newsletter is to provide investors with global macro insights into the financial markets so they can better understand the developing global story.
Follow Andy on Twitter: @andrewnyquist
No position in any of the mentioned securities at the time of publication. Any opinions expressed herein are solely those of the author, and do not in any way represent the views or opinions of any other person or entity.


")
")
 Rolling Over At Key Fibonacci Level?")

