The majority of the worlds stocks markets have been in an uptrend the past few years. The global stock market sell off now has the majority of these stock markets testing bull markets across the globe as several have reach long-term support channels.
As you can see from the 6-pack of charts below, world stock markets from the U.S. to Asia and Europe are all in rising channel bull market trends over the past few years. The declines this month has each of these key markets testing the bottom of their respective rising channels (and bull markets). click to enlarge chart
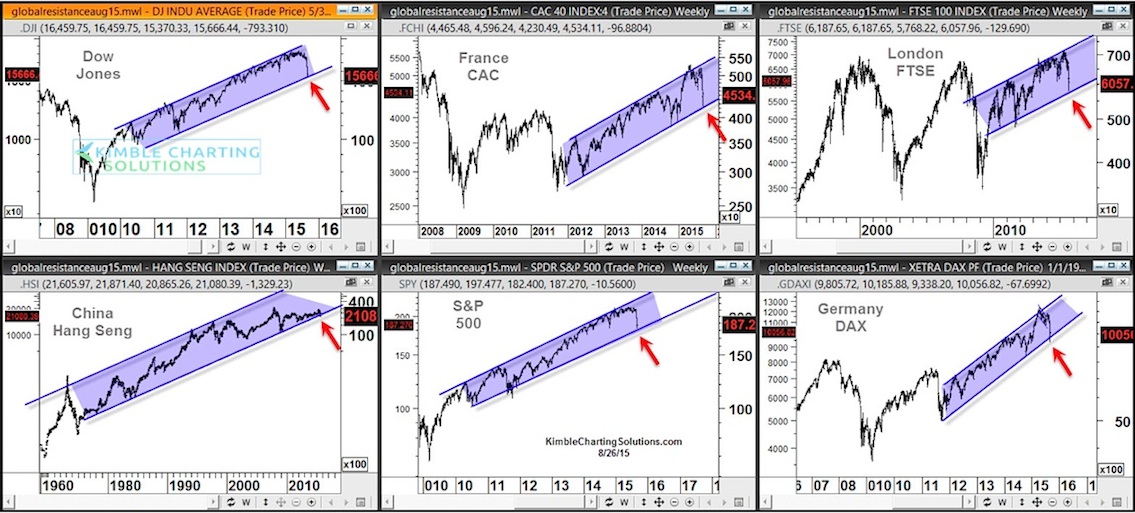
Even though many say a correction or bear market in taking place right now, from a Power of the Pattern perspective, each of the bull markets trends are still in play… but being put to a very big test right now.
Risk is very high at this time in my humble opinion. I say this from a correlation perspective. What do I mean by that?
As you can see the majority of these patterns look the same! Diversification of assets, spreading money around in stock markets in different parts of the world, isn’t reducing risk much, as they are all acting the same.
The risk here on a global basis is this: We live in a highly correlated world and if one of these markets breaks support, they all could! If one breaks support and ends its multi-year up-trend, the others could follow.
Question: Over the past few years, has it paid to be a buyer or seller when these markets are on support? I think you know the answer to that question.
Bigger Question: Will it be different this time?
The global rising up-trend is still in play but, as I said, the bull markets are being put to a critical test. Support is support until it’s broken my friends.
I am surprised of this… the decline from a 30,000 foot view has not been very big (support still in play), yet from a sentiment perspective we are seeing indicators reach levels that took place after the S&P 500 declined 50% in 2003 and 2009. Does it seem strange to you that sentiment levels similar to 2003 and 2009 and the market is only down just over 10 percent?
Keep this global perspective in mind, if one of these key markets breaks support, the others could well do the same and create a deeper decline. Stay tuned – Global bull markets are at a critical price point right now!
Thanks for reading.
Twitter: @KimbleCharting
Author does not have a position in any mentioned securities at the time of publication. Any opinions expressed herein are solely those of the author, and do not in any way represent the views or opinions of any other person or entity.


